Download this document
here (MS Word, 2,719 KB)
(To Table of Contents)
TITLE PAGE
Creating a Geologic Play Book for Trenton-Black River
Appalachian Basin Exploration
Semi-Annual Report
Reporting Period Start Date: April 1, 2004
Reporting Period End Date: September 30, 2004
Principal Authors:
Douglas G. Patchen, Chris Laughrey, Jaime Kostelnik, James Drahovzal, John B. Hickman, Paul D. Lake, John Bocan, Larry Wickstrom, Taury Smith and Katharine Lee Avary
October 2004
DOE Award Number: DE-FC26-03NT41856
West Virginia University Research Corporation
P.P. Box 6845, Morgantown, WV 26506-6845
University of Kentucky Research Foundation
109 Kinkead Hall, Lexington, KY 40506-0057
New York State Museum Institute
Room 3140 CEC, Albany, NY 12230
Ohio Division of Geological Survey
4383 Fountain Square, Columbus, OH 43224
Pennsylvania Geological & Topographic Survey
400 Waterfront Drive, Pittsburgh, PA 15222-4745
West Virginia Geological & Economic Survey
1 Mont Chateau Road, Morgantown, WV 26508-8079
(To Table of Contents)
DISCLAIMER
"This report was prepared as an account of work sponsored by an agency
of the United States Government. Neither the United States Government nor any
agency thereof, nor any of their employees, makes any warranty, express or implied,
or assumes any legal liability or responsibility for the accuracy, completeness,
or usefulness of any information, apparatus, product, or process disclosed, or
represents that its use would not infringe privately owned rights. Reference herein
to any specific commercial product, process, or service by trade name, trademark,
manufacturer, or otherwise does not necessarily constitute or imply its endorsement,
recommendation, or favoring by the United States Government or any agency thereof.
The views and opinions of authors expressed herein do not necessarily state or
reflect those of the United States Government or any agency thereof."
(To Table of Contents)
ABSTRACT
The "Trenton-Black River Appalachian Basin Exploration Consortium" has reached
the mid-point in a two-year research effort to produce a play book for Trenton-Black
River exploration. The final membership of the Consortium includes 17 exploration
and production companies and 6 research team members, including four state geological
surveys, the New York State Museum Institute and West Virginia University. Seven
integrated research tasks and one administrative and technology transfer task
are being conducted basin-wide by research teams organized from this large pool
of experienced professionals.
All seismic data available to the consortium have
been examined at least once. Synthetic seismograms constructed for specific wells
have enabled researchers to correlate the tops of 10 stratigraphic units determined
from well logs to seismic profiles in New York and Pennsylvania. In addition,
three surfaces in that area have been depth converted, gridded and mapped. In
the Kentucky-Ohio-West Virginia portion of the study area, a velocity model has
been developed to help constrain time-to-depth conversions. Fifteen formation
tops have been identified on seismic in that area. Preliminary conclusions based
on the available seismic data do not support the extension of the Rome Trough
into New York state.
Members of the stratigraphy task team measured, described
and photographed numerous cores from throughout the basin, and tied these data
back to their network of geophysical log cross sections. Geophysical logs were
scanned in raster files for use in detailed well examination and construction
of cross sections. Logs on these cross sections that are only in raster format
are being converted to vector format for final cross section displays.
The petrology team measured and sampled one classic outcrop in Pennsylvania and ten cores in
four states. More than 600 thin sections were prepared from samples in those four
states. A seven-step procedure is being used to analyze all thin sections, leading
to an interpretation of the sequence of diagenetic events and development of porosity
in the reservoir.
Nearly 1000 stable isotope geochemistry samples have been collected
from cores in four of the five states in the study area. More than 400 of these
samples will be analyzed for fluid inclusion and/or strontium isotope analyses,
as well.
Gas samples have been collected from 21 wells in four states and analyzed
for chemical content and isotope analyses of carbon and hydrogen. Because natural
gases vary in chemical and isotope composition as a function of their formation
and migration history, crossplots of these values can be very revealing. Gas from
the Homer field in Kentucky indicates compartmentalization and at least two different
sources. Gas from the York field in Ohio also came from at least two discrete
compartments. Gas from the Cottontree field in West Virginia is very dry, probably
generated from post-mature source rocks. Isotope reversals may be indicative of
cracking of residual oil. Gas from Glodes Corners Road field in New York also
is post-mature, dry gas, and again isotope reversals may indicate cracking of
residual oil in the reservoir. Noble gases are predominantly of crustal origin,
but a minor helium component was derived from the mantle.
The project web server
continues to evolve as the project progresses. The user/password authenticated
website has 18 industry partner users and 20 research team users. Software has
been installed to track website use.
Two meetings of the research team were held
to review the status of the project and prepare reports to be given to the full
consortium. A meeting of the full consortium - industry partners and researchers
- was very successful. However, the ultimate product of the research could be
improved if industry members were more forthcoming with proprietary data.
TABLE OF CONTENTS
(To Table of Contents)
EXECUTIVE SUMMARY
The West Virginia
University Research Corporation (Research Corporation) was awarded a contract
by the U.S. Department of Energy through the National Energy Technology Laboratory
to create a geologic play book for Trenton-Black River exploration in the Appalachian
basin.
The Research Corporation assigned the contract to the Appalachian Oil and
Natural Gas Research Consortium (AONGRC), a program at the National Research Center
for Coal and Energy at West Virginia University. The AONGRC organized a Trenton-Black
River Research Team, consisting of recognized experts currently employed by the
State geological surveys in Kentucky, Ohio, Pennsylvania and West Virginia, and
the New York State Museum Institute, an agency in the New York State Education
Department.
The Research Corporation, working with the AONGRC, created an industry-government-academic
partnership, the "Trenton-Black River Appalachian Basin Exploration Consortium"
(the Consortium), to co-fund and conduct the research effort. Seventeen gas exploration
companies joined the Consortium. Each contributed cost share through a two-year
membership fee, and several expressed an interest in supplying data and expertise
while taking an active research role.
This project has three main objectives:
- to develop an integrated, multi-faceted, resource assessment model of Trenton-Black
River reservoirs in New York, Ohio, Pennsylvania, Kentucky and West Virginia;
- to define possible fairways within which to conduct more detailed studies leading
to further development of the gas resource in these reservoirs; and
- to develop an integrated structural-stratigraphic-diagenetic model for the origin of Trenton-Black
River hydrothermal dolomite reservoirs.
The Consortium will achieve these goals by conducting research in eight integrated task areas:
Task 1. Structural and seismic analysis and mapping
Task 2. Analysis of stratigraphic relationships and thickness mapping
Task 3. Analysis of petrographic data and synthesis of depositional environments
Task 4. Analysis of isotope geochemistry and fluid inclusion data
Task 5. Analysis and summary of petroleum geochemistry data
Task 6. Analysis of production, data/histories and horizontal well technology
Task 7. Data, GIS and website management
Task 8. Play book compilation and project management
Researchers have examined and interpreted all of the seismic data that is currently available
to the consortium. To aid in the correlation between well logs and seismic profiles,
synthetic seismograms were made for key wells, providing an intermediate correlation
step between geophysical logs and seismic data. These seismograms have enabled
researchers to identify formations tops on seismic, and to begin the process of
mapping these tops and stratigraphic intervals throughout the basin. A database
has been created for the seismic and well log data.
Preliminary conclusions based
on the available seismic do not support the extension of the Rome Trough into
New York state. Instead, this Cambrian syntectonic trough extends from West Virginia
into Pennsylvania, but turns eastward just south of the New York line and dies
out in northeastern Pennsylvania. The presence of the trough in Pennsylvania can
be a significant factor in the development of reservoirs in that state.
The process
of scanning geophysical logs continued. Numerous logs have been scanned in raster
files for use in detailed well examination and cross section construction. Logs
that are only in raster format are being converted to vector format for final
cross section displays.
Numerous cores have been examined, described, photographed
and sampled, and all of the information has been tied back to geophysical logs
for these wells. A database was created for all stratigraphic information, both
from logs and from cores.
Now that individual log picks have been made, regional
correlations established and cross sections constructed, geologists have moved
into the regional mapping phase of the research. This process includes facies
analysis and mapping.
More than 600 thin sections have been made for the petrograpic
study, which will aid researchers in their attempt to determine the timing of
diagenetic events, development of porosity and emplacement of hydrocarbons in
the reservoir. The petrographic work also will provide a physical frame of reference
for the geochemical studies, which are being conducted to better understand the
dolomitization processes that created the reservoirs.
The isotope geochemistry
and fluid inclusion efforts have begun to yield some interesting results. Nearly
1000 samples have been taken for analyses from cores in four states. The research
team is analyzing the stable isotope, fluid inclusion and strontium isotope data
that are coming back from the laboratories.
Data from the petroleum geochemistry
task is even more revealing at this point. Gas collected from 21 wells in New
York, Ohio, West Virginia and Kentucky has been analyzed and preliminary conclusions
regarding the maturity of source beds, gas mixing, compartmentalization of reservoirs,
and cracking of oil in the reservoirs can be made.
Gases produced from Trenton-Black
River reservoirs are early mature to post-mature. Gases produced from the Homer
field in Kentucky are compartmentalized and from at least two different sources.
Gases from York field in Ohio also come from at least two discrete reservoir compartments.
Gases produced in New York are post-mature and exhibit isotopic reversals. These
reversals may be due to gas mixing or cracking of gases from residual oil in the
reservoirs. Noble gas geochemistry indicates a predominantly crustal origin, with
a minor helium component derived from the mantle.
Production data for 2003 in
New York and West Virginia were added to the project database, and some preliminary
interpretations of production profiles have been made.
Well data from West Virginia
will be used to initiate the population of the project's "wells layer" for the
base map. The website has been developed and is accessible to consortium members.
Software was purchased and installed, allowing us to track website use by industry
partners.
Two meetings of the full research team were held, one in Morgantown
in July and the other in Pittsburgh in September. A meeting of the full consortium
was held in Pittsburgh, the day following the research team meeting. The project
is on schedule and on budget, and industry partners have expressed satisfaction
with the research team's approach and progress to date.
(To Table of Contents)
EXPERIMENTAL
Petrology
The purpose of the petrographic portion of the Trenton-Black River research is
to enhance field studies and core descriptions, determine the diagenetic history
of the reservoir rocks, and provide a frame of reference for geochemical studies
in the project. Specifically, we want to understand the history of cementation
in the rocks, and the development of secondary porosity relative to the emplacement
of hydrocarbons in these rocks.
The results of the petrographic studies also will
provide a physical frame of reference for geochemical studies aimed at understanding
the dolomitization processes in the reservoirs (Task 5) and source rock geochemistry
(Task 4). Other project researchers are conducting stable isotope analyses, fluid
inclusion studies, 87Sr/86Sr, and trace element analyses in order to interpret
the dolomitization history of the Trenton and Black River carbonate reservoirs.
The petrographic descriptions of these rocks will provide a textural template
for the geochemical interpretations. The petrographic data also will be useful
for interpreting the depositional setting of source rocks that are identified
by geochemical means.
A complete discussion of the status of the petrographic
study can be found in the description of Task 3, "Analysis of Petrographic Data
and Synthesis of Depositional Environments." For a detailed discussion of how
individual thin sections are examined and described, the reader is referred to
the appendix.
Gas Isotope Studies
A geochemical investigation of natural gases
produced from Trenton and Black River carbonate reservoirs in the Appalachian
basin is being conducted as part of the overall research effort to create a geologic
playbook for these targets. Specifically, we are concerned with the chemical composition
of the gases, the stable isotope composition of the hydrocarbon gases, and the
noble gas chemistry of selected samples. A better understanding of these parameters
will provide genetic information about the gases and allow us to recognize and
quantify gas mixing, if any, in the subsurface (Schoell, 1983; Jenden and others,
1993; Laughrey and Baldassare, 1998). The data also will assist in the identification
of subsurface reservoirs, and will be useful for mapping discrete fault blocks
in compartmentalized reservoirs (Schoell and others, 1993). Finally, stable isotope
data can aid in the identification of the source of natural gases in a reservoir
(Whiticar, 1994). The purpose of this investigation is to assess the potential
utility of all of these applications of gas isotope geochemistry in the Trenton/Black
River play.
A more complete discussion of this topic can be found below under
Task 5, "Analysis and Summary of Petroleum Geochemistry Data." Gas samples have
been collected from wells using standard techniques and equipment. These samples
were then submitted to a professional testing laboratory, Isotech Laboratories
in Champaign, Illinois, for molecular and isotopic analyses. Samples are prepared
offline and then analyzed by dual inlet isotope ratio mass spectrometer (IRMS).
Data that are returned from the lab are interpreted by project researchers.
Geochemical Studies
A range of geochemical and fluid inclusion analyses are being conducted
on Trenton and Black River limestone and dolomite samples to help build models
that depict the formation of dolomitized reservoirs within limestone formations
and to aid in stratigraphic correlation between widely spaced control points.
Hydrothermal carbonate cements generally have specific geochemical attributes
that can be determined using proven geochemical techniques. Usually, but not always,
hydrothermal carbonate cements have fluid inclusion homogenization temperatures
between 75 and 250 degrees centigrade and salinities between 6 and 30 weight percent;
negative oxygen isotope values that are lighter than the marine signature; radiogenic
strontium ratios relative to seawater for the time of deposition; and high iron
and manganese contents.
Fluid inclusions can pinpoint the temperature of formation
and the salinity of the fluid from which the various minerals were precipitated.
Fluid inclusion data can be determined for matrix dolomite, saddle dolomite, calcite
and quartz. In this project, all fluid inclusion analyses are being performed
by Fluid Inclusion Technologies in Tulsa, Oklahoma. However, all interpretations
of these data are being performed by project staff members.
A complete description
of the status of the geochemical work can be found below under Task 4, "Analysis
of Isotope Geochemistry and Fluid Inclusion Data."
(To Table of Contents)
RESULTS AND DISCUSSION
Task 1: Structural and Seismic Investigations
Structural and seismic analyses are being
carried out to characterize the major geologic structures of the study area and
to determine as closely as possible their timing relative to the fracturing, dolomitization,
and hydrocarbon charging of the Trenton-Black River interval. To accomplish this,
well and seismic data are being used together to map the Precambrian surface,
including fault locations and major structural axes, which may be indicators of
potential Trenton-Black River dolomitized and/or fractured target areas. In addition,
contour maps are being constructed using the two combined data sets to develop
the following:
- Top of basal sandstone
- Basal sandstone isopach
- Knox Unconformity
- Top of Trenton Limestone
- Top of Ordovician
- Other horizons or isopach maps that may be helpful to the objectives of the project
In developing these maps,
well-data tops agreed to by the five research agencies are being used together
with two-way-travel times from available seismic data. The two-way-travel times
are being converted to depths in feet based on sonic data and formation- tops
data from the wells.
Data
Existing seismic data already available for this study
at the five research agencies form a general base for the project. Each of the
sponsoring companies, however, has been and is being solicited for contributions
of additional data. The additional data are considered critical to meeting the
objectives of this part of the study. The solicitations began with e-mails sent
to the seismic-data representative at each company in February 2004. The e-mail
contact was followed up with telephone calls to each company representative. In
addition, some face-to-face contacts were made prior to the September 9, 2004
meeting with the following people and companies:
- Scott Gorham, Seneca Resources, in Houston
- Jeff Lester, Seismic Exchange Inc., in Houston
- Ben Rummerfield, GeoData, in Houston
- Pinar Yilmaz, Exxon, in Houston
- Bernie Miller, representing Abarta Oil and Gas, in Lexington
- David Cox, North Coast Energy, in Lexington.
In addition, Bill Grubaugh of Enervest (not part of the consortium) was contacted
by phone concerning the possible contribution of 3-D data at Saybrook in Ohio.
Table 1 outlines the contacts and results as of the end of September 2004.
Table 1. Seismic Data for the Trenton-Black
River Consortium
| Company |
Contact |
Phone |
Results |
| Abarta |
Jim Wigal |
412-963-6226 |
1-2 lines in KY; asking Bertagne permission; other data given up; Bernie Miller |
| Belden and Blake* |
John Thomas |
330-499-1660 |
Waiting to see who will contribute, concerned, confidentiality;
data now Talisman's |
| Cabot |
Jim Wilson |
304-347-1641 |
No data available |
| Ceja |
Ron Snyder |
918-496-0770 |
Don't know; checking with attorneys again; originally committed; no shot point map |
| Compton |
Ron Gerlitz |
403-205-7817 |
No data available |
| Enervest (CGAS) |
Bill Grubaugh |
614-781-3270 |
Checking with new owners and partners on Saybrook 3-D data |
| EOG |
Ed Elliott |
724-743-2764 |
Willing to help, especially in E OH and SW PA; but no shot point map |
| Equitable |
Joe Morris |
412-395-3928 |
Seisco and some ARCO data; checking with Seisco; sending sh pt map |
| EXXON** |
Pinar Yilmaz |
281-654-7465 |
Will allow for 3rd party data |
| GeoData* |
Biff Rummerfield |
713-465-9911 |
Will give permission of 3rd party data |
| Great Lakes |
Bill Zagorski |
330-877-6747 |
Checking contracts with partners; skeptical; no shot point map |
| New York Museum |
Taury Smith |
518-473-6262 |
DATA; western NY |
| North Coast |
David Cox |
304-273-5371 x218 |
DATA; several lines in WV |
| Petro Evaluation |
Jay Henthorne |
330-264-4454 |
Sending DATA for Musking. Co. OH thru John Foreman; possibly more |
| Pioneer |
Tom Spalding |
972-444-9001 |
SEI data; difficult to obtain; no shot point map |
| Seisco** |
Les Lambert |
504-821-4610 |
DATA; covers much of KY, WV; some in PA, NY; KGS has rights |
| Seismic Exchange** |
Jeff Lester |
832-590-5100 |
Visited in April; concerned; issues: rights and sharing; want +$; shot point maps |
| Seneca |
Scott Gorham |
713-654-2639 |
Visited in April; data in PA; issues: confidentiality, rights, access; shot point map |
| Schlumberger |
|
|
Not contacted for seismic data |
| Talisman |
Bob Bonner |
403-237-1327 |
Data in NY,PA, flds & neg. results; B&B data; stick map prep |
| Texas Keystone |
Neil Sullivan |
412-434-5616 |
Talked with John Taylor; he will provide data as appropriate |
| Ultra |
Steve Kneller |
303-645-9801 |
SEI data, checking on availability; local lines related to prospects |
| Vintage |
Rick Lindsay |
918-878-5280 |
Willing to help; looking for data; area unknown; no shot point map |
* Now owned by Capitol C Energy Operations
** Not a sponsor
jad 9/30/2004
As a result of the seismic data contributed by
the five research agencies and industry, the following datasets were made available
and loaded into Kentucky Geological Survey's (KGS's) seismic interpretation
workstations:
- Digital and paper data made available by the KGS, covering eastern
Kentucky, West Virginia, and parts of Pennsylvania and New York
- Digital data made available by the New York State Museum, covering parts of western New York
- Paper data made available by the Pennsylvania Geological Survey, covering part of western Pennsylvania.
- Digital data made available by North Coast Energy,
covering small parts of West Virginia
The map in Figure 1 shows the extent of the more than 3,400 miles of data that
is currently available for seismic interpretation in the project.
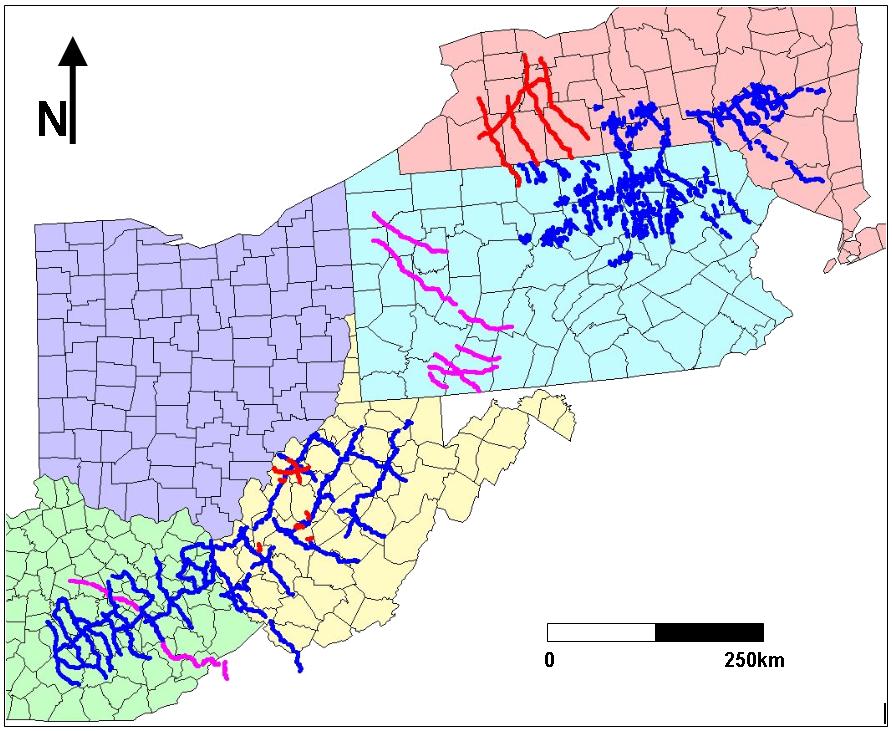 Figure 1.
 Map of the study area showing the location of currently
available 2D seismic data.
In addition, discussions of the possibility of further available data for the study are
currently underway with the following consortium members and others (Table 1):
- Seneca Resources for data in Pennsylvania
- Petro Evaluation for data in part of Muskingum County, Ohio (with the possibility of some other additional data)
- Abarta Oil and Gas for data in a small part of eastern Kentucky
- Ohio Geological Survey for COCORP data crossing central Ohio
- Exxon data for the Appalachians
- Ultra Petroleum Corp. for data in Pennsylvania
- CGG data for data in the Appalachians
- Talisman Energy for data in south-central New York
- Seismic Exchange, Inc. for Appalachian data licensed by several of the sponsoring companies
- Equitable Production for data in Kentucky and other parts of the Appalachians
As can be seen from Figure 1, many areas have little available seismic data at this
point in the study. Those areas include all of Ohio, northeastern and extreme
southeastern portions of Kentucky, several parts of western Pennsylvania, parts of
West Virginia and several parts of southwestern New York. To date, no data for
Ontario have been sought.
Several problems have arisen with regard to the securing of seismic data for the project.
Perhaps the most serious problem is the fact that much of the older and formerly
available data from the major oil companies has now been purchased by and handled
through major data brokers. These brokers are often uneasy with consortium's use of
their data. Fortunately, negotiations with one of them are being greatly aided by a
representative of one of the sponsoring companies. The fears of contractual violation
and the compromising of proprietary data are at the root of the brokers' concerns and
are most understandable. It is our hope that we will have the opportunity to use much
of this type of seismic data, while being sensitive to the brokers' concerns and fully
maintaining the integrity of the data.
In attempting to preserve the integrity of the seismic data provided, our approach has
been to restrict access and interpretation of the data to just three geologists at the
KGS and to hold the data secure in a locked interpretation room at KGS. These three
geologists sample two-way-travel-times for several of the horizons discussed above at
intervals along each line. The data derived from the seismic profiles are then used
to calculate depth conversions based on estimated velocities for a particular area and
interval. In this way, the actual data from the seismic profiles are not recorded on
a map or table that is part of any report distributed to the consortium. The derived
data are then used to construct the above discussed regional scale maps. All data
profiles are returned to the owner upon completion of the process.
Another problem has been the "wait and see" attitude of some of the sponsoring companies.
The feeling has been that one company should not share with another for fear of not
receiving reciprocal information, again a logical fear. With the September 2004
workshop, however, much of this feeling seems to have dissipated, as can be seen from
the number of companies with whom we are now negotiating the use of data (Table 1).
Currently, we have focused on U.S. data and have not made overtures to Ontario for
seismic data. Neither have we attempted to collect gravity and magnetic data.
These efforts will be carried out in the future.
Structural and Seismic Investigations
Interpretation of several prominent reflecting horizons within the seismic data has
begun in large portions of eastern Kentucky, West Virginia, north-central Pennsylvania
and south-central New York. In addition to the original 3,400 mile GeoFile Appalachian
seismic dataset, eleven analog records (paper copies) of regional seismic lines for
Pennsylvania have been scanned and loaded into PetraSeis software. Five digital
(SEG-Y) regional seismic lines for western New York State have been added to the
database and loaded into Kingdom Suite software. Nine digital (SEG-Y) regional and
field-scale seismic lines for central West Virginia have been also added into the
Kingdom Suite database, including 2-3 processed versions of each line (enhanced stack,
migrated, etc.) (Fig. 1). In addition, well data has been compiled into a single
database for the study area (Fig. 2).
Specific regional seismic horizons as well as numerous local horizons have been
interpreted for the northeastern Pennsylvania/southern New York region, including but
not limited to:
- Tully Ls (Taghanic)
- Oriskany Ss. (Deerparkian)
- Salina Gp. (Canastotan)
- Lockport Gp. (Lockportian)
- Clinton Gp./Rochester Sh. (Tonowandan)
- Queenstone Fm. (Richmondian)
- Trenton Gp. (Shermanian)
- Black River Gp. (Blackriverian)
- Knox/Beekmantown Gp. (Croixian)
- Basement (Grenville)
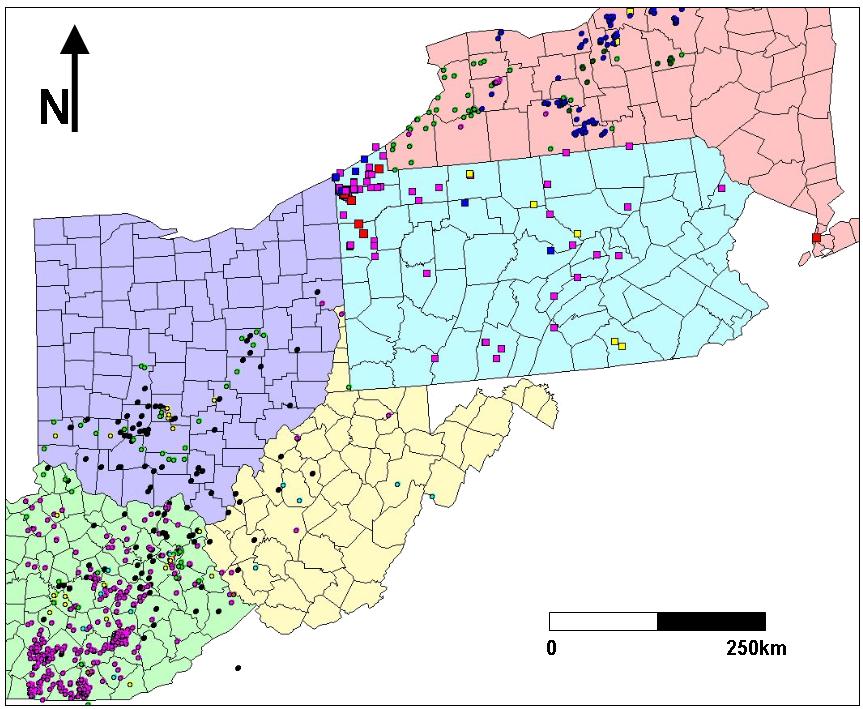 Figure 2.
 Map showing the location of the wells within
the study area used for seismic correlation to date.
Two north-south cross-sections labeled A and B are provided in Figure 3 as an example
of the level of work that has been carried out to date. The seismic data has been
omitted in these figures for proprietary reasons. These seismic lines are partially
constrained by wells that were converted to two-way time and projected along strike to
the lines. Seismic resolution decreases with depth; however, it was possible to resolve
the basement on these lines. Note that much of the thickening has occurred below the
Beekmantown Group and within the Rose Run Formation. Also note the connection with what
appears to be Alleghanian salt tectonics, basement faults and Trenton sag features.
Figure 4 shows a seismic line across the northern edge of the eastern Rome Trough, and
Figure 5 crosses the northern edge of the Northern Rome Trough in West Virginia.
The syntectonic sediments within the trough can be observed between the Nolichucky
Shale (dark green) and the basement (yellow).
The interpretation of the important horizons within the study area allows the gridding
of these surfaces to produce two-way time structure maps. Figures 6 and 7 both show
the Tully Ls. as a two-way time structure map. Figure 6 shows the Tully Ls. with the
two-way time contours in seconds, and Figure 7 displays the geologic contacts on the
surface and how the Tully Ls. structure mirrors the structure of the surface geology.
The wells within the study that were converted to two-way time using measured and
calculated sonic velocities, allow time-to-depth conversions of horizons.
Horizons converted to depth and gridded in the Pennsylvania and New York part of the
project area include:
- Tully Ls (Devonian)
- Trenton Ls (Ordovician)
- Precambrian metamorphic basement
Within Kentucky, Ohio, and West Virginia a multi-layer velocity model was created to
help further constrain the time-to-depth conversions of seismic horizons, and to aid
in stratigraphic correlation in areas of low-resolution seismic data. The model was
created from the formation tops contained in 763 wells, and sonic logs from 54 wells.
Sonic-log data was averaged with petrophysical software (TerraStation) within groups
of strata, resulting in precise internal velocities.
Error checking is performed during the interpretation stages by mapping the time to
these horizons and analyzing for any anomalies, and by comparing estimated depths and
stratigraphic thicknesses with local well data. A regional, 3-D geological velocity
model is currently being created in order to constrain time-to-depth conversions.
Examples of two of these layers are displayed in Figures 8 and 9 for Kentucky, Ohio,
and West Virginia. Figure 8 shows the internal velocity within the Trenton Fm., and
Figure 9 shows the internal velocity of the Maryville Ls.
Preliminary structural maps for parts of the area have been generated using the
interpretations from the wells and seismic data that are currently available.
These initial maps will be updated as more seismic data become available and as
additional velocity information from wells clarify time-to-depth relationships.
Well tops and depth-converted seismic horizons can then be combined to generate
structure and isopach maps of stratigraphic units within the study area. Figures 10,
11, 12a, 12 b, and 13 show the process of generating a structure map of the basin from
the initial seismic interpretation to a larger regional map. Figure 10 shows the
two-way time structure map of the Trenton. Figure 11 shows that same map after it was
converted to depth. Figure 12a shows the depth map of the basement from the seismic
data gridded with well tops to expand the map outside the area covered by seismic data.
Figure 12b shows the counterpart structure map generated in the southern area of this
study. Finally, Figure 13 shows the regional map generated for the southern part of the
study area combined with the map generated in the north.
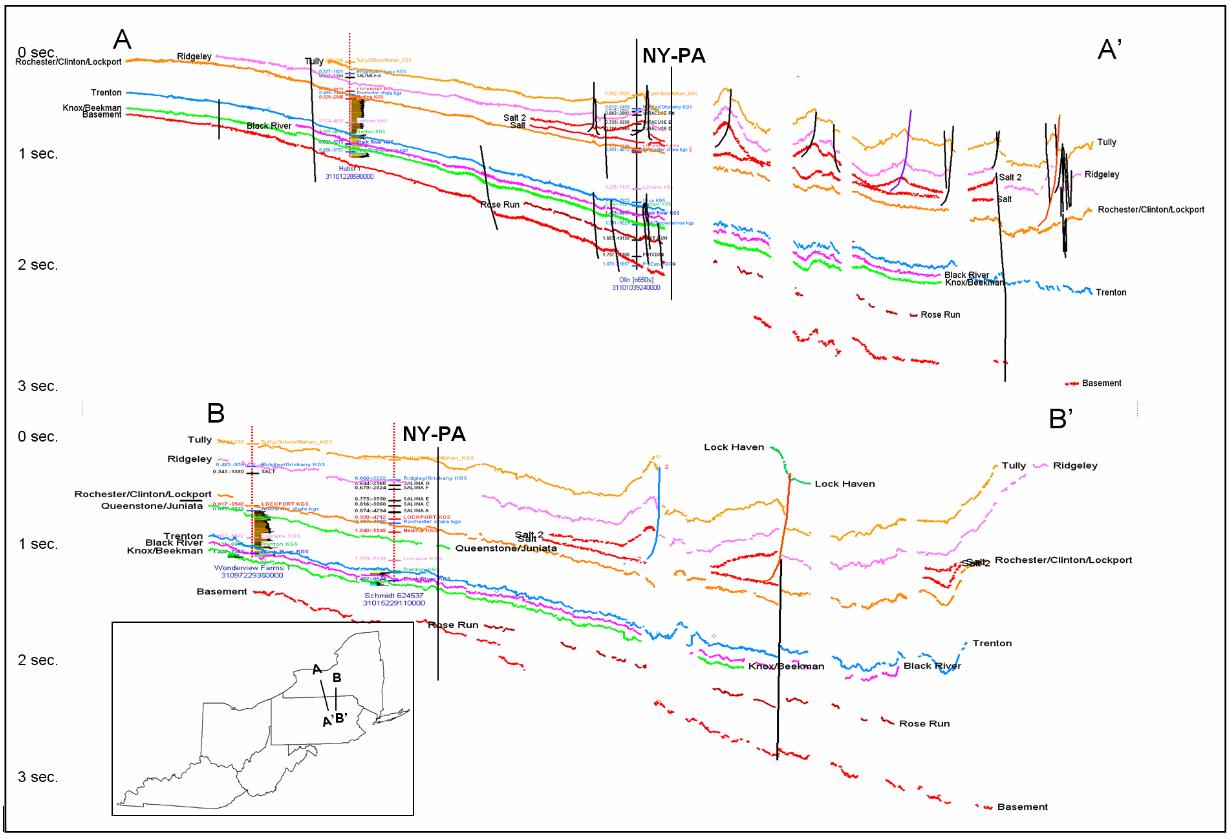 Figure 3.
 Two initial cross-sections in southern NY and northern PA. These dip lines
are based on 2D seismic data (not shown here). Both lines end in the south near the
Allegheny Front. Note the Alleghanian salt tectonics that occurred because of the
mobilization of evaporites in the Salina Gp. Seismic resolution is poor at depth;
however, albeit is possible, with the help of well control, to resolve the basement
on these and other lines within the study area. There is a possible connection between
the spatial distribution of the basement faults, Trenton sags, and the later salt
tectonics. This is an initial interpretation and will
be updated as the study progresses and as more seismic data becomes available.
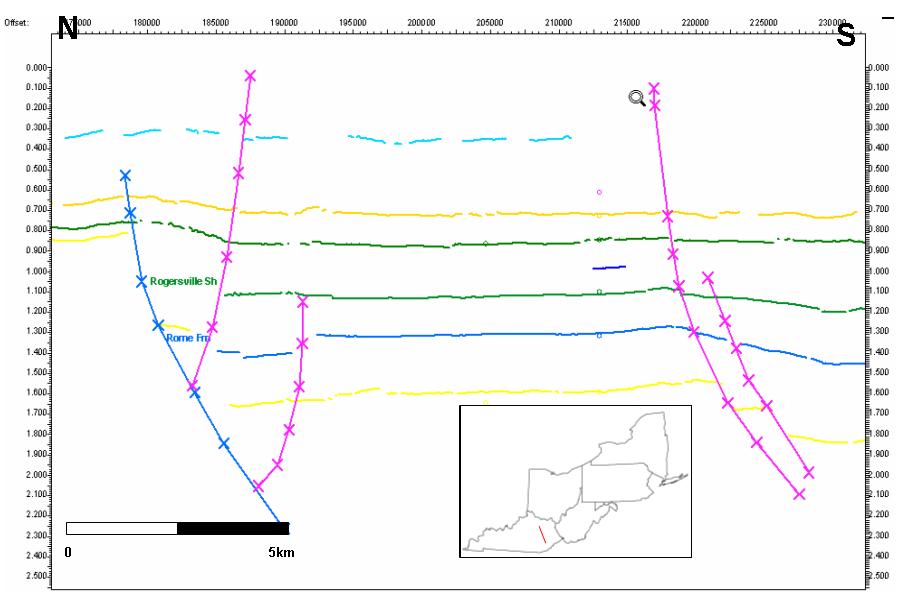 Figure 4.
. Northern edge of the Rome Trough in Kentucky. The syntectonic sediments within the trough can be observed between the Nolichucky Sh. (dark green) and the Basement (yellow).
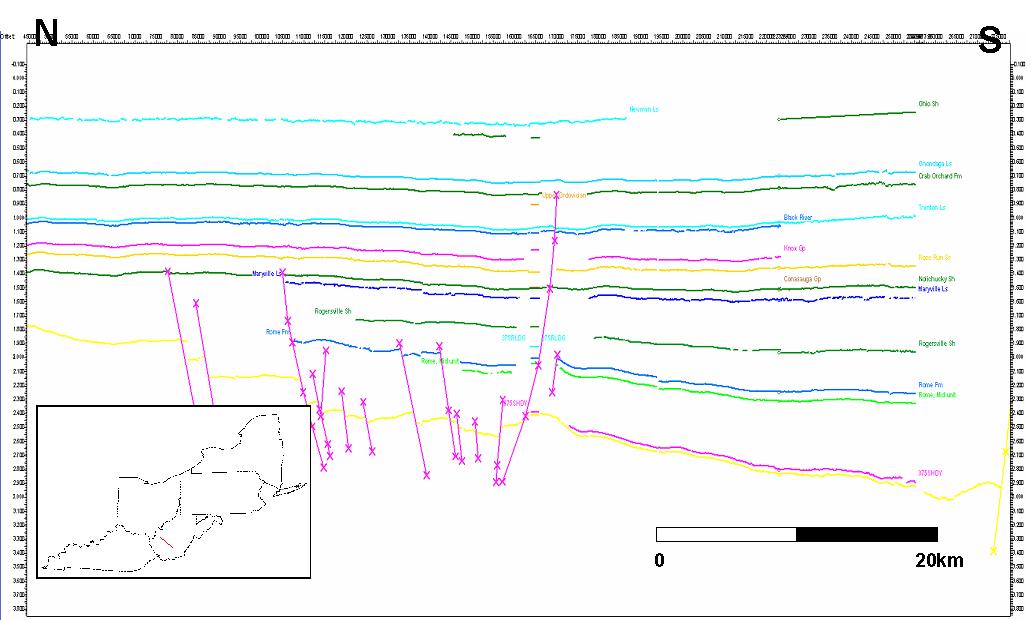 Figure 5.
 Northern Rome Trough in West Virginia. The syntectonic sediments within the trough can be observed between the Nolichucky Sh. (dark green) and the Basement (yellow).
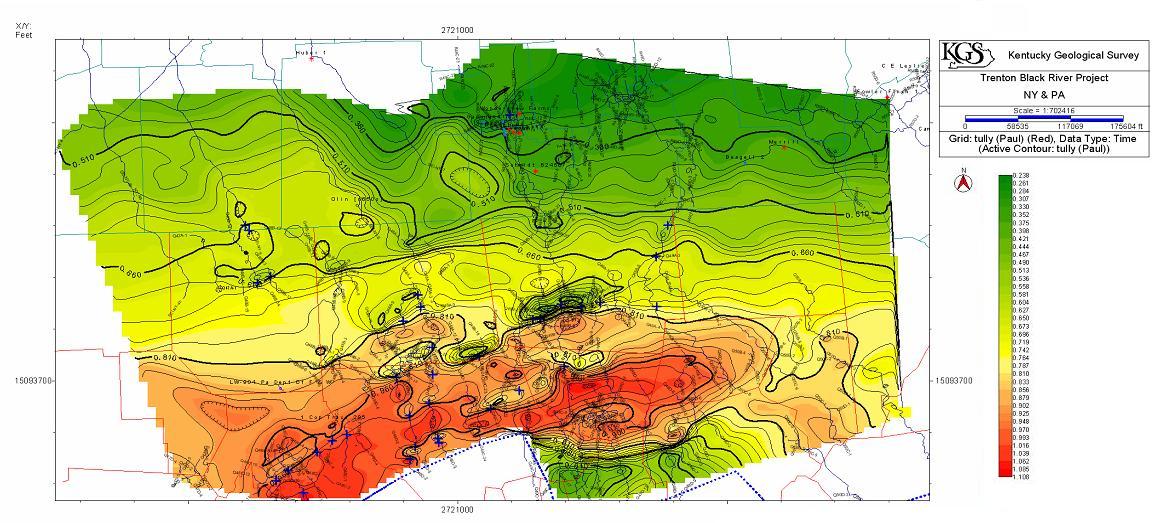 Figure 6.
 Time structure map of the Tully Ls. generated from the available 2D seismic data. The Tully Ls. is an important regional seismic reflector in New York and Pennsylvania (faults not shown).
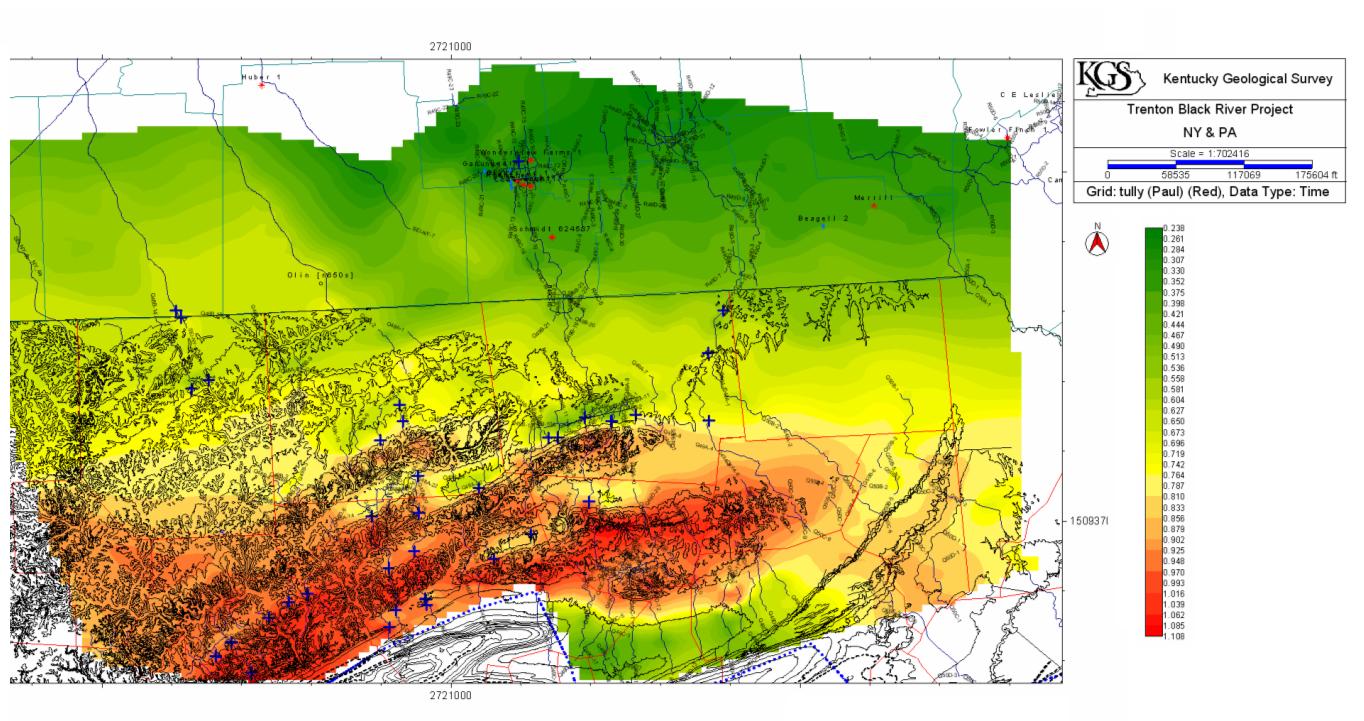 Figure 7.
 Time structure map of the Tully Ls. displayed in Figure 6 with the geologic map overlaid, demonstrating the reliability of the seismic-data interpretation to resolve the structure in the subsurface.
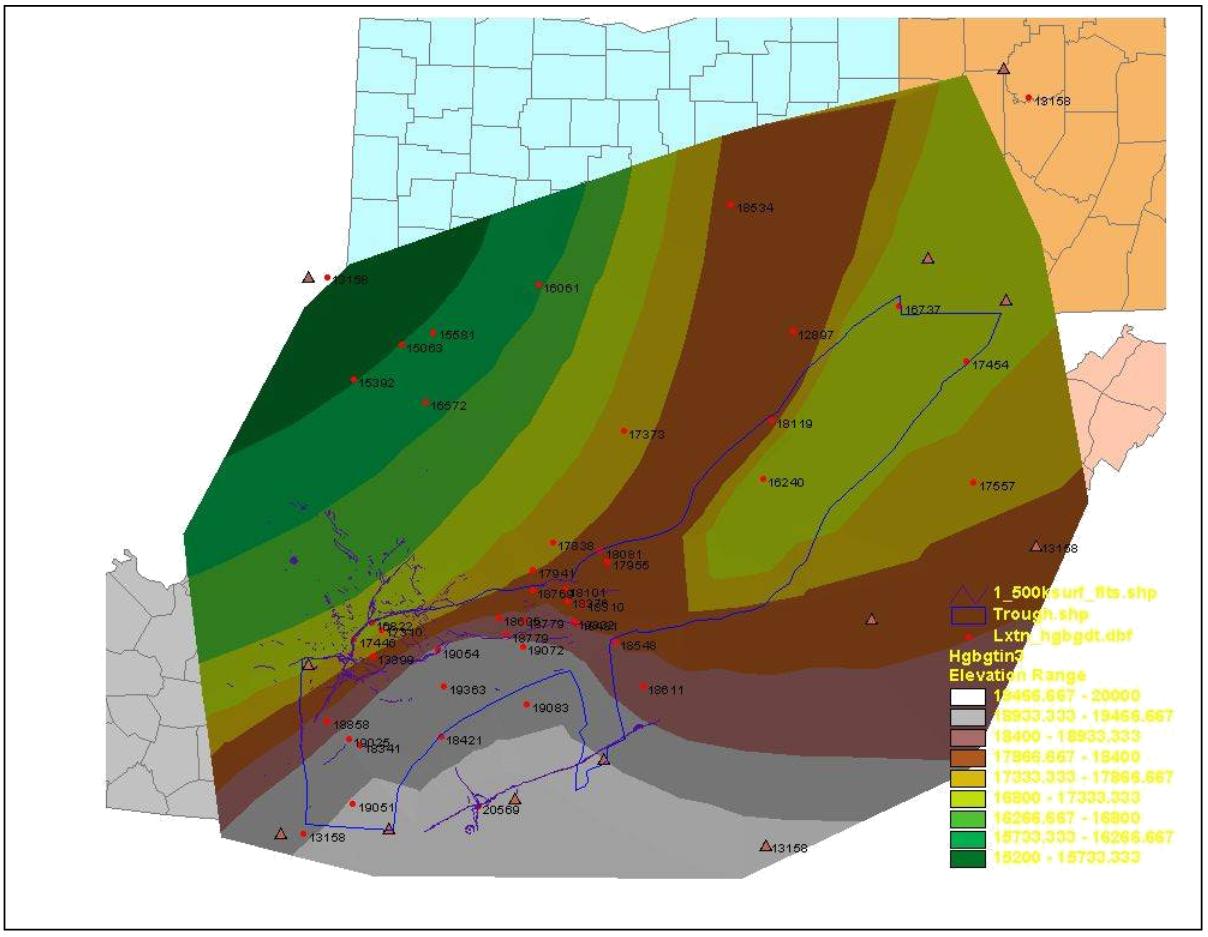 Figure 8.
 Map showing the internal velocity for the Trenton Fm. This layer is part of a velocity model that was created for time-depth conversion calculations in interpreting seismic data.
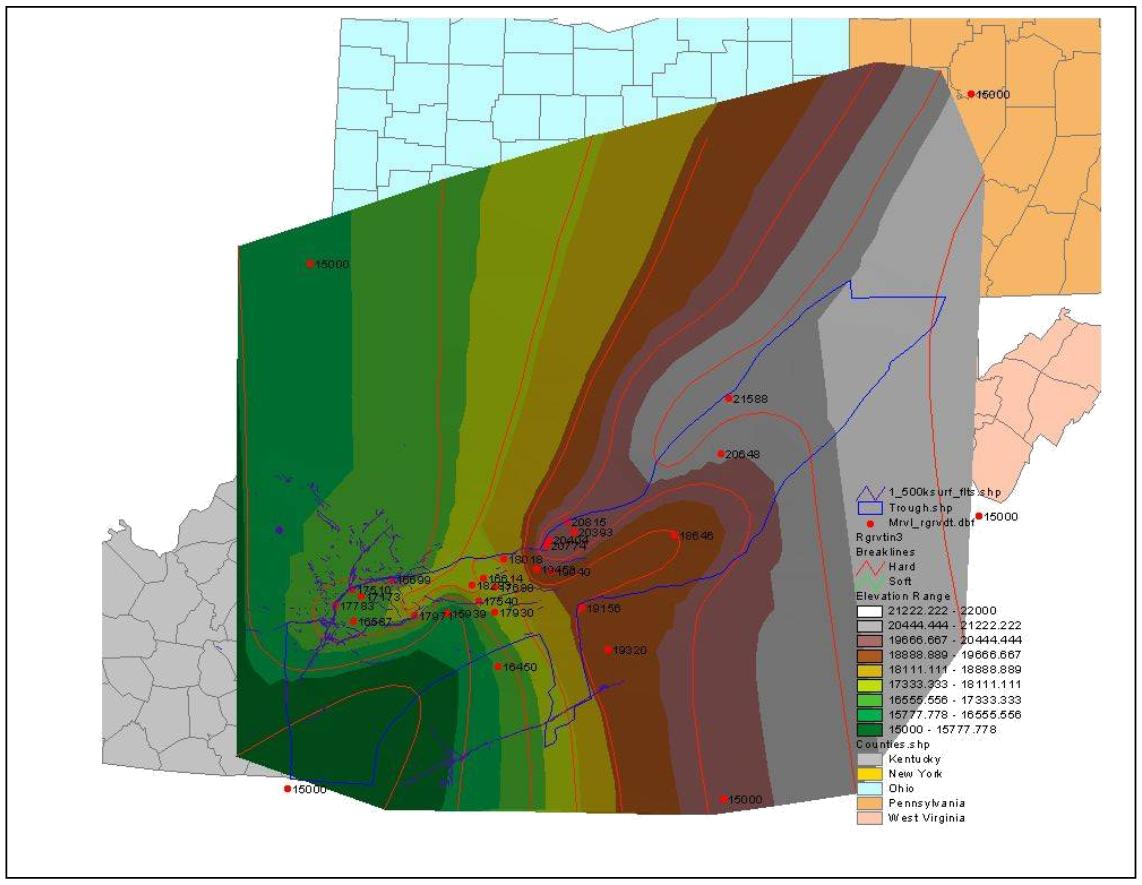 Figure 9.
 Map showing the internal velocity for the Maryville Ls. This layer is part of a velocity model that was created for time-depth conversion calculations in interpreting seismic data. This figure and the previous figure demonstrate the effects of the Rome Trough on the interval velocity.
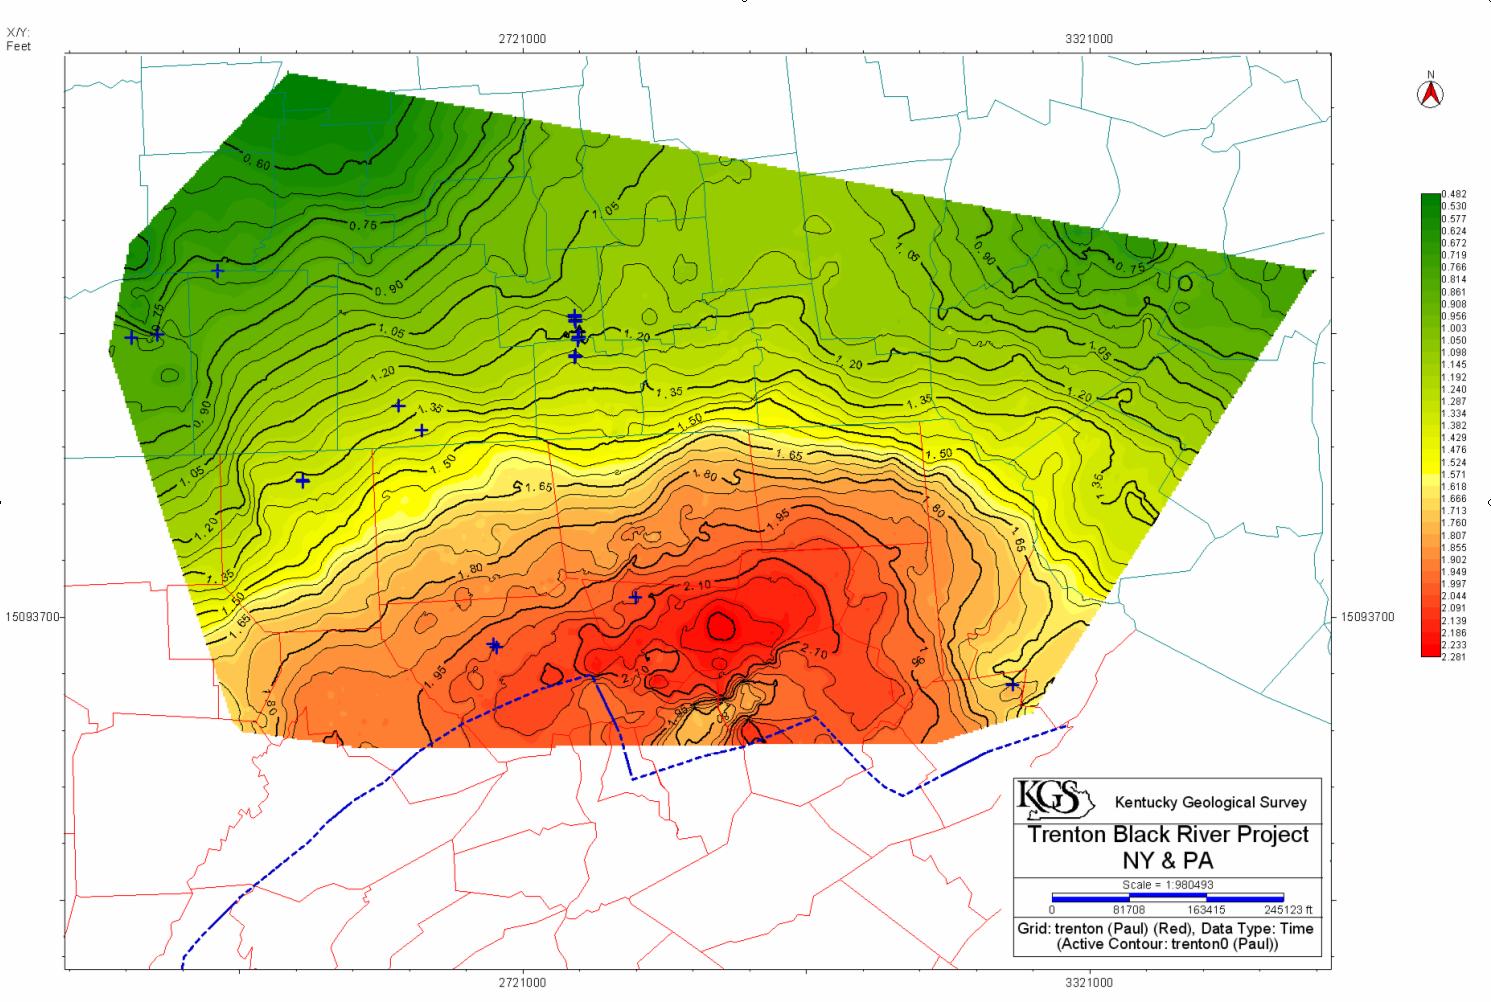 Figure 10.
 Two-way-time structure map for the top of the Trenton Ls. The formation of the Alleghanian foreland basin controlled much of the Trenton Ls. structure.
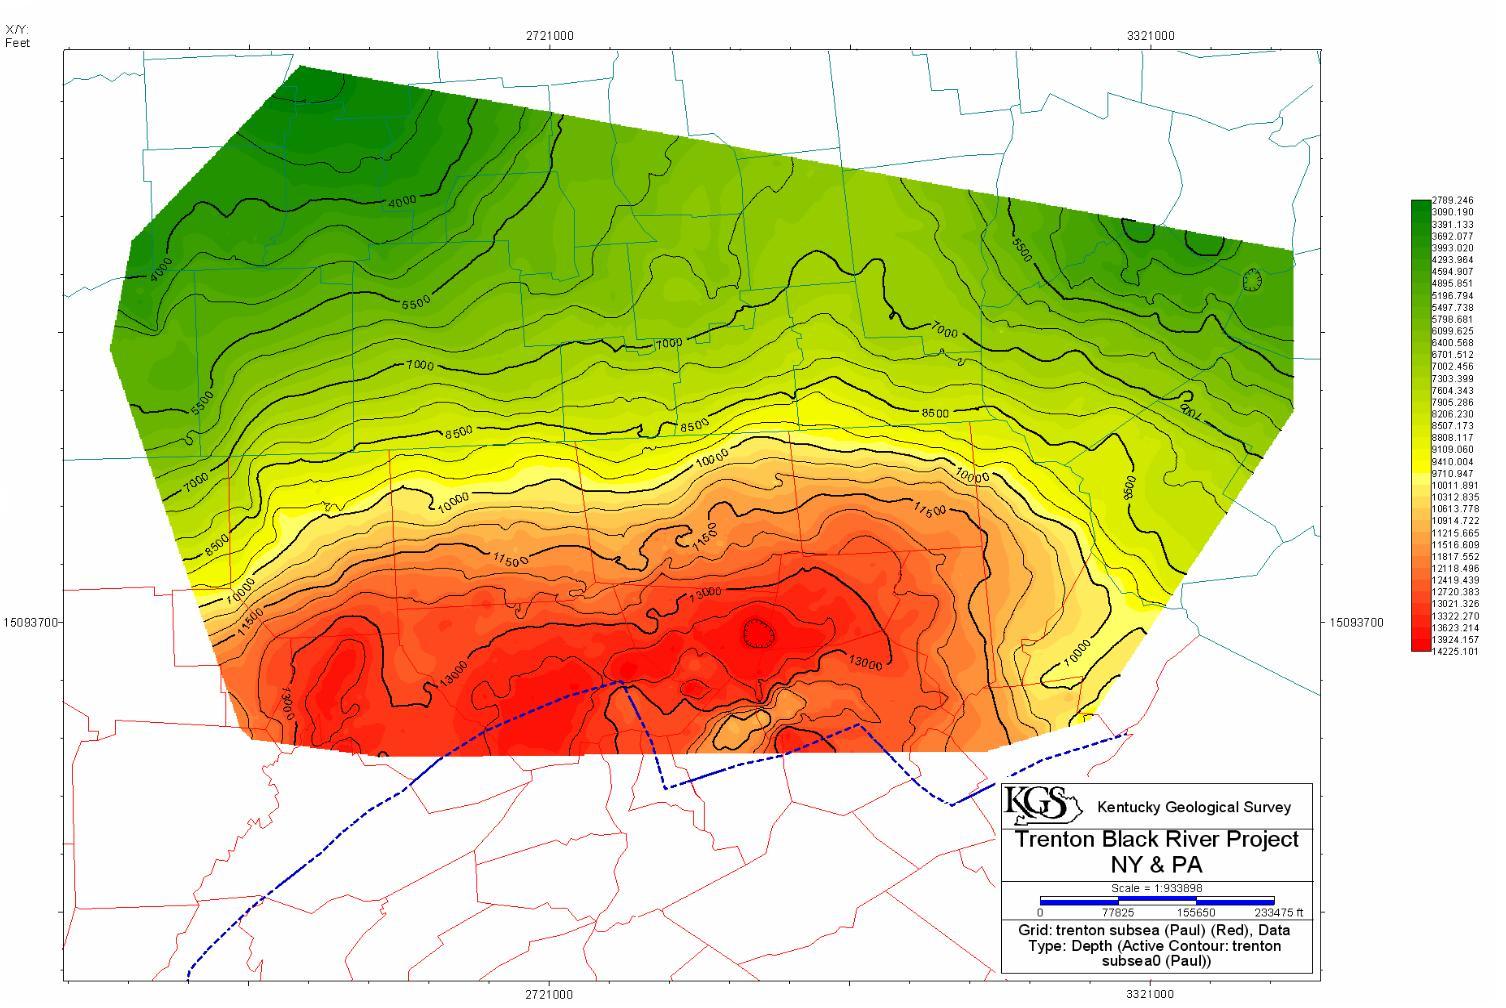 Figure 11.
 Structure map of the top of the Trenton Ls., based on 2-D seismic dataconverted to depth from time-to-depth curves calculated from the well data.
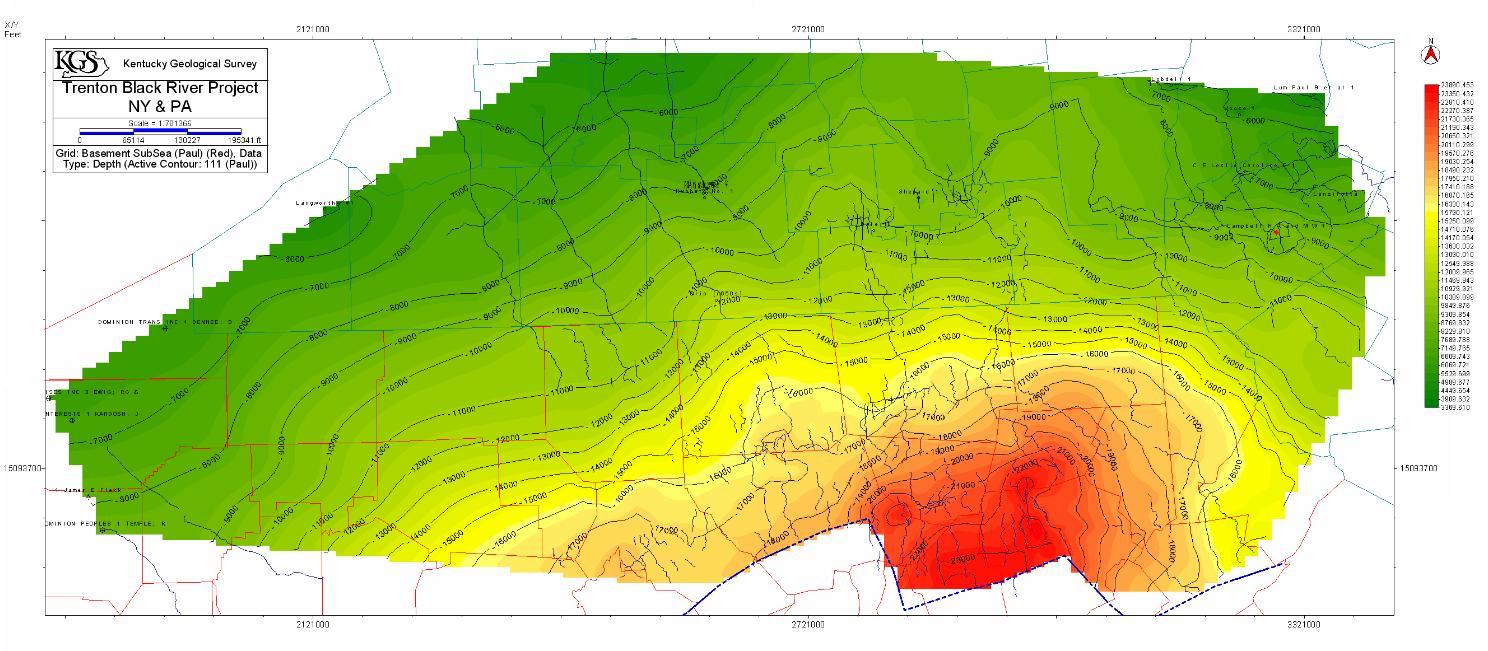 Figure 12a.
 Structure map of the top of the basement based on well tops and available seismic data (major fault systems not shown) in New York and Pennsylvania.
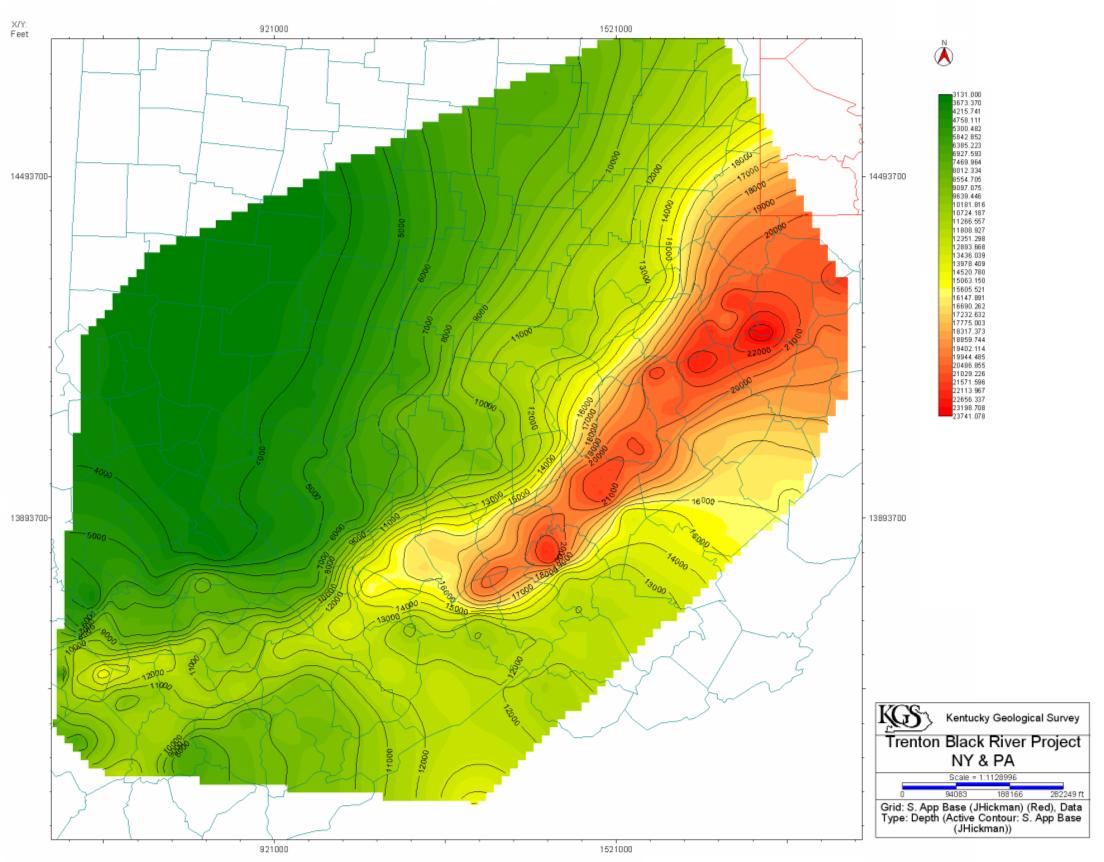 Figure 12b.
 Structure map of the top of the basement based on well tops and available seismic data (major fault systems not shown) in Kentucky, Ohio, and West Virginia.
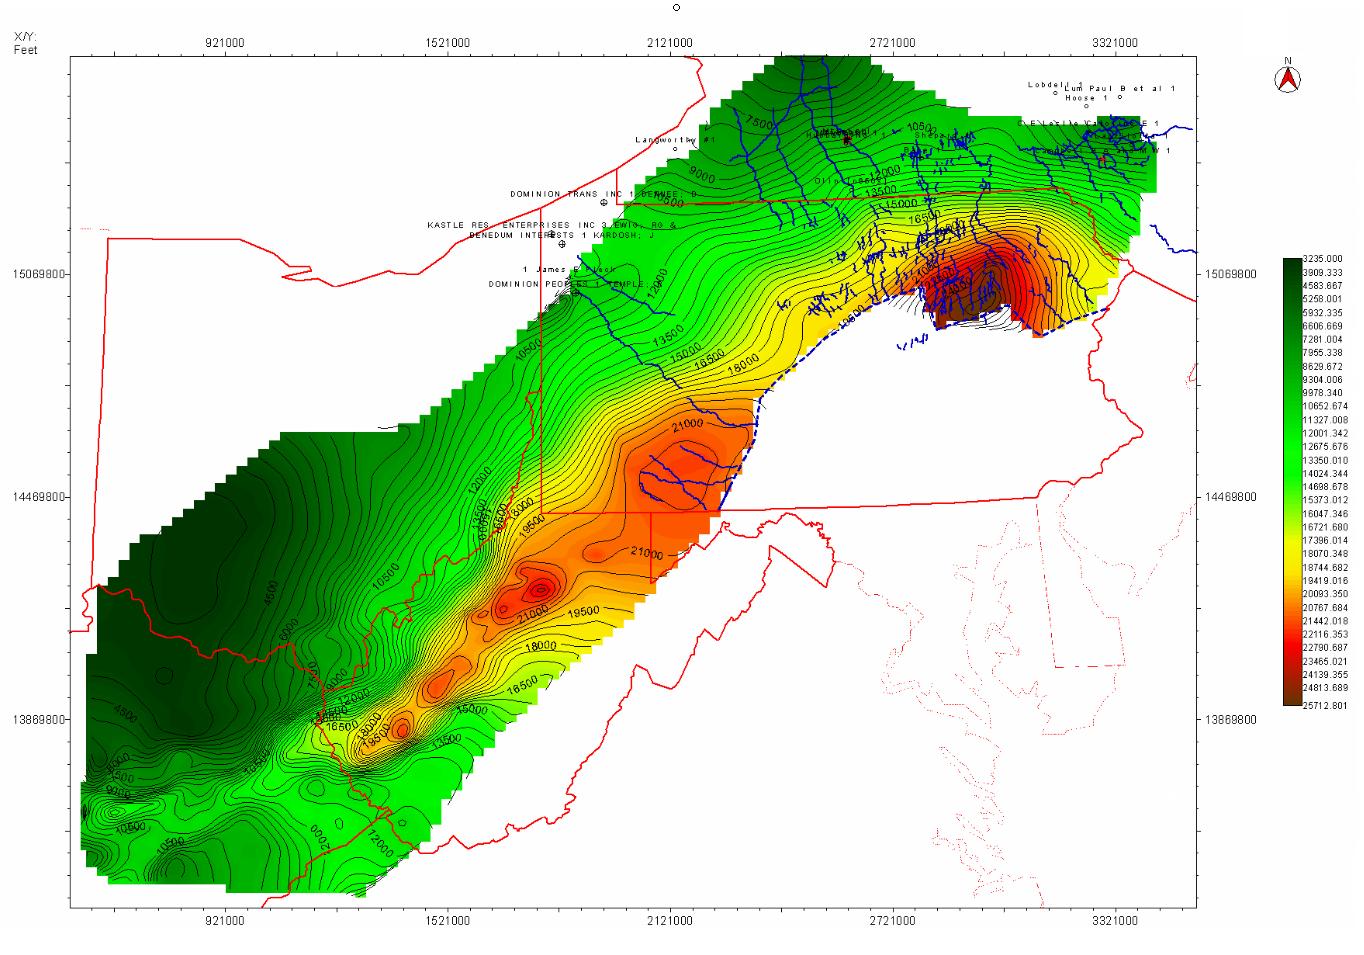 Figure 13.
 Structure contour map of the top of the basement in the Northern Appalachian Basin (faults not shown here). The structure of the basement is a result of Cambrian rifting and later Alleghanian compression and foreland basin formation.
Preliminary Conclusions
Past exploration for Trenton-Black River hydrocarbons has shown that basement faulting (often with a wrench component), structural sags, and hydrothermal dolomite within the Trenton and Black River carbonates can indicate possible traps and reservoirs of oil and natural gas. One of the major objectives of this project is to map the basement faults within the Appalachian Basin. One of the most prominent systems of basement faults in the basin are those related to the Rome Trough, a Cambrian rift system that can be traced from central Kentucky through West Virginia and into Pennsylvania. There are three credible models or hypotheses on the location of the Rome Trough northeast of West Virginia. These are listed below with the main reference:
- Cross-strike Structural Discontinuities (Harper, 1989)
- Major and minor branches of the Rome Trough (Ryder, 1992)
- Pennsylvanian Rome Trough (Shumaker, 1996)
Ongoing seismic interpretations completed at the KGS show some level of support for all
three models. Further study may allow a more definitive understanding of these models.
Though the numerous basement faults that exist in New York State exhibit evidence for cross-strike structural discontinuities, the well and 2-D seismic data examined to date show no evidence of Cambrian syntectonic sedimentation. In contrast, Pennsylvania shows areas with significant basement offset as well as Cambrian syntectonic sedimentation (Figure 3) similar to the Rome Trough of Kentucky and West Virginia (Figures 4 and 5). Cross-section B-B' shows a basement offset in Pennsylvania near the New York border that exhibits growth on the southern, downthrown side, but with little to no offset in the overlying strata. This same growth fault appears to have been identified by Beardsley and Cable (1983) as recorded by Ryder (1992). Initial structure maps of the basement (figure 13) and past studies, including those of the Rome Trough consortium study (Rome Trough Consortium, 2002), suggest that the Rome Trough transforms from a full graben in Kentucky to a half graben system in West Virginia. The boundary fault in West Virginia is to the southeast with less offset along the northwestern edge of the trough.
On the southern end of cross-section B-B' another basement fault can be observed (though this may in-fact be a seismic pushdown from the Salina Gp. evaporties); however, in this case the downthrown side is to the north, and strata are offset equally from the basement to at least the Lockport Dolomite. This fault is far too young to be involved in Cambrian rifting. It is, however, important to note that this fault appears to have played an important role in the location of the overlying salt tectonic decollement thrust. These types of basement faults may be different in age from those associated with the Cambrian rifting, but they may still be important conduits for hydrothermal fluids. Therefore surface thrusts and antiforms may help in the location of faults that penetrate the basement but that were not necessarily involved in Cambrian rifting. Isopach maps of various stratigraphic intervals will help in identifying those faults associated with the Cambrian rifting as opposed to later tectonic events. However, both types of faulting likely will be important in identifying potential areas of
hydrothermal dolomitization and possible Trenton-Black River reservoirs.
Task 2: Stratigraphic Analysis and Thickness Mapping of Key Units
The Ohio Division of Geological Survey (ODGS) continues to lead Task 2, coordinating the efforts of team members in four state geological surveys and the New York State Museum. Geologists have examined numerous cores from across the basin, as well as a number of sample strings. Observations from these investigations have been recorded, cores have been photographed, and all of the information has been tied back to geophysical log suites. Numerous geophysical logs have been scanned in raster files for use in detailed well examinations and cross section construction.
A database has been created for all stratigraphic data. Data on all available cores have been sought and entered in this database. A map showing the location of all cores in the study area has been prepared.
A regional correlation chart showing the total interval from the Precambrian through the Ordovician has been constructed with input from all participants.
Geologists have created regional cross sections over the entire area of study using raster and vector log files. These cross sections have been presented to the working group as a whole and meetings were held to work out differences of interpretations and formation picks on logs. Logs being used in the cross sections that are only in raster format are now being converted to vector format for final cross section displays.
Using the knowledge gained from cross section analysis, regional correlations, and core and sample examinations, facies analysis and mapping are now underway.
We also are starting to record log picks for wells and put these in the database for individual unit mapping.
Task 3: Petrology and Petrography of Trenton and Black River Carbonates
The petrography of carbonate reservoir rocks in the Trenton and Black River Groups in the Appalachian basin is being investigated as part of the AONGRC research effort to create a geologic playbook for these Upper Ordovician targets. The purpose of the petrographic portion of the research is to enhance field studies and core descriptions, determine the diagenetic history of the reservoir rocks, and provide a frame of reference for geochemical studies in the project.
The petrographic work supplements field and core descriptions through the identification of constituent grains, by providing detailed classifications of the reservoir rocks, and by providing detailed microfacies analyses that strengthen interpretations of depositional environments. These data directly support the stratigraphic interpretation effort (Task 2). Furthermore, there is evidence that carbonate facies might exert at least some control on the subsurface flow paths taken by dolomitizing fluids in the Trenton and Black River carbonates.
Our interest in the diagenetic history of the Trenton and Black River carbonates revolves around determining the timing of significant diagenetic events. Specifically, we want to understand the history of cementation in the rocks, and the development of secondary porosity relative to the emplacement of hydrocarbons. We also want to understand the effects of the carbonate pore texture and geometry on geophysical log response in the reservoirs.
The petrographic work also provides a physical frame of reference for geochemical studies aimed at understanding dolomitization processes in the reservoirs (Task 5) and source rock geochemistry (Task 4). Researchers at the New York State Museum are conducting stable isotope analyses, fluid inclusion studies, 87Sr/86Sr, and trace element analyses in order to interpret the dolomitization history of the Trenton and Black River carbonate reservoirs. The petrographic descriptions of these rocks provide a textural template upon which the geochemical interpretations will sit. The petrographic data also will be useful for interpreting the depositional setting of source rocks identified by geochemical means.
Core and Outcrop Sampling Progress as of October 2004
- Pennsylvania:
- We completed a detailed stratigraphic and sedimentologic description and interpretation of a complete Trenton and Black River Groups section at Union Furnace in central Pennsylvania. This is one of three excellent outcrop locations we are describing to use as calibration sections for subsurface work The other two are in the Mohawk Valley in NY state (see Smith and Nyahay, 2004) and just southeast of Lexington, KY. We also described and sampled a complete core recovered adjacent to the Union Furnace outcrop in Pennsylvania.
- We described and sampled a whole-diameter core of the middle Trenton Group and lower Black River Group recovered from the Emma McKnight #1 well in Pymatuming Township, Mercer County, PA.
- We described and sampled sidewall core samples of the Trenton and Black River rocks recovered from the Montgomery #4 well in Wolf Creek Township, Mercer County, PA.
- West Virginia:
- We described and sampled the Hope Natural Gas # 9634 well (Sandhill well) in Wood County, WV.
- Ohio:
- We described and sampled whole-diameter core from the Strayer #1 well in Allen County, OH.
- We described and sampled whole-diameter core from the Prudential #1 well in Marion County, OH.
- We described and sampled the Ohio Geological Survey #3267 whole-diameter core from Auglaize County, OH.
- We described and sampled whole-diameter core from the #3479 Henderson well in Hancock County, OH.
- We described and sampled the Ohio Geological Survey #2459 whole-diameter core from Wood County, OH.
- Kentucky:
- We described and sampled whole-diameter core from the Cominco American well in Montgomery County, KY.
- Thin Sections:
- We collected and prepared, or now have in preparation, a total of 631 thin sections of Trenton and Black River carbonate samples from all of these locations, as well as from additional wells in Ohio.:
- Prepared 102 thin sections from PA samples.
- Collected 172 thin sections from eight wells in OH.
- Collected 177 thin sections prepared from the Sandhill well in WV.
- Presently preparing 180 thin sections from the wells in OH, KY, and WV listed above.
Analytical Procedure
We are analyzing all thin sections by the following procedure:
- Identification of skeletal grains.
- Identification of micrite (when present).
- Identification of carbonate and other cements.
- Classification of porosity in each sample.
- Assignment of the sample to a standard microfacies for interpretation of original depositional setting.
- Identification of compactional and deformational features.
- Interpretation of diagenetic sequence:
- Cementation
- Microbial micritization
- Neomorphism
- Dissolution
- Physical and chemical compaction
- Dolomitization
- Porosity development, modification and preservation.
Examples of detailed petrographic descriptions that follow this analytical procedure can be found in the appendix.
We will begin to post our petrographic descriptions on the project website in the near future.
Task 4: Isotope Geochemistry and Fluid Inclusion Analysis
The Task 4 Team is comprised solely of staff members from the New York State Museum. However, this task team has been assisted by members of other geological surveys and task teams during the data collection phase of the project.
To date, the team has sampled cores from New York, Ohio, West Virginia and Kentucky, and plans to sample cores in Pennsylvania before the end of the year.
Four hundred and twenty eight (428) samples were taken from cores in Ohio. All of the samples were sent out for stable isotope analysis, and all of these data were received from the laboratory. In addition, 20 of these samples were sent to a laboratory for fluid inclusion and strontium isotope analysis. Again, all of these data were received. Finally, samples were prepared for trace element analysis and the analysis should be done before the end of the next calendar quarter.
One hundred and thirty three (133) samples were collected from West Virginia wells and sent out for stable isotope analysis. A few fine dolomite samples will be submitted for strontium analysis from the lowermost Black River. This appears to be early dolomite and it should be different than the hydrothermal dolomites in the Trenton and Black River Groups. There were no cements that were worth sending out for fluid inclusions.
Kentucky cores yielded 273 samples. These samples were sent out for stable isotopes, fluid inclusions and strontium isotope analyses and we are awaiting the results. Meanwhile, we are preparing samples for trace element analysis.
We have sampled and conducted stable isotope, strontium isotope, fluid inclusion and trace element analysis on 140 samples from cores in New York.
This task is on time and on budget. Everything should be done by the time stated in the original agreement.
Task 5: Petroleum Geochemistry of Trenton and Black River Gases
The Pennsylvania Geological Survey (PGS) has accepted the lead role in Task 5. PGS staff geologist and Task Team Leader Christopher Laughrey has designed and is conducting, with his task team members, a study of the isotope geochemistry of Trenton-Black River gases in the Appalachian basin.
The task team is investigating the geochemistry of natural gases produced from carbonate reservoirs in the Trenton and Black River Groups in the Appalachian basin as part of the AONGRC research effort to create a geologic playbook for these Upper Ordovician targets. Specifically, they are analyzing the chemical composition of the gases, the stable isotope composition of the hydrocarbon gases, and the noble gas chemistry of selected samples. These data provide genetic information about the gases and allow us to recognize and quantify gas mixing in the subsurface (Schoell, 1983; Jenden and others, 1993; Laughrey and Baldassare, 1998). The data also assist us in exact reservoir identification in the subsurface, and are useful for mapping discrete fault blocks in compartmentalized reservoirs (Schoell and others, 1993). Finally, the stable isotope data can aid in correlating the natural gases in a reservoir to their source (Whiticar, 1994). Indeed, recent work by Burruss and Ryder (2004) suggests the distribution of natural gas mixtures in the subsurface may define migration fairways to deep reservoirs in the Appalachian basin. The purpose of this investigation is to assess the potential utility of all of these applications of gas isotope geochemistry in the Trenton/Black River play.
To date, the team has collected 21 gas samples from producing Trenton/Black River wells in the Appalachian basin (Table 2). These samples include:
- 10 samples from the New York fields:
- 5 samples from Glodes Corners Road field in Steuben Co.
- 1 sample from Muck Farm field in Steuben Co.
- 1 sample from Wilson Hollow field in Steuben Co.
- 1 sample from County Line field in Chemung Co.
- 1 sample from Terry Hill South field in Chemung Co.
- 1 sample from the #1Andrews well in Steuben Co.
- Six samples from the York field in Ashtabula County, Ohio
- Two samples from the Cottontree field in Roane County, West Virginia
- Two samples from the Homer field in Elliott County, Kentucky
- One sample from Collin Fork field in Clay County, Kentucky.
In addition, data were obtained from one additional Trenton Group well in the Homer field in Kentucky collected during a previous study (sample 22, Table 2). Future sampling will include additional wells in New York, Ohio and West Virginia, and wells in north central Pennsylvania.
Acknowledgments
The following companies granted permission to collect gas samples from their wells:
- Triana Energy and Columbia Natural Resources
- Fortuna Energy Inc.
- Hay Exploration
- K Petroleum
- CGAS Exploration/Enervest
In addition, Isotech Laboratories in Champaign, Illinois conducted all of the compositional and hydrocarbon isotope analyses of the samples. Robert J. Poreda, University of Rochester, carried out the noble gas analyses of selected samples for Isotech Laboratories. Several individuals assisted in collecting and analyzing samples from throughout the basin:
- Dick Beardsley and Ed Rothman at Triana Energy
- Jeff Bowers at Fortuna Energy
- Monte Hay at Hay Petroleum
- Bill Grubaugh at Enervest
- Katharine Lee Avary at the West Virginia Geological Survey
- David Harris at the Kentucky Geological Survey
- Larry Wickstrom at the Ohio Geological Survey
- Dennis Coleman at Isotech Laboratories
- Martin Schoell at GasConsult International.
Results to Date
Table 3 presents the chemical analyses of the gas samples that were collected.
These include hydrocarbons, helium, hydrogen, argon, oxygen, carbon dioxide and nitrogen,
reported in mol percent. Table 4 presents the isotope analyses of carbon and hydrogen
for all methane samples, and carbon isotope compositions of ethane, propane, isobutene, and normal butane of selected samples.
All stable isotope values are reported in parts per thousand (permil).
- General Genetic Information
- Individual gas components in our samples (CH4, C2H6
etc.) can be characterized by their stable carbon (13C/12C)
and hydrogen (2H/1H or D/H) isotopic compositions (Schoell,
1983). We use the delta (δ) notation to express the isotopic composition
of the gases we sampled:
-
| δ13C (permil) = [(13C/12C)SAMPLE/(13C/12C)PDB
- 1] 1000 |
(Eq. 1) |
| δD (permil) = [(D/H)SAMPLE/(D/H)SMOW
- 1] 1000 |
(Eq. 2) |
- PDB and SMOW are the international reference standards for carbon and hydrogen
stable isotopes, respectively (see Hoefs, 1997).
- Natural gases vary in chemical and isotope composition as a function of
their formation and migration history. Crossplots of these values for the
methane in the samples we collected reveal that the carbon and hydrogen become
heavier, i.e., enriched in 13C and D, with depth consistent with
increasing thermal maturation (Figure 14). The gas sample from Collin Fork
field in Clay County, KY is early mature and associated with oil. Gases from
the Homer field in Elliott County, KY plot in two distinct regions of the
genetic diagram in Figure 14. One sample (sample 20 in Tables 2 - 4) from
the Oliver 50 (T2) well in Homer field is clearly an oil-associated gas generated
relatively early in the oil widow. The two other samples from Homer field
(21 and 22 in Tables 2 - 4) plot astride the boundary between the oil window
and the post-mature gas field. These data suggest at least two separate source
rocks for Trenton reservoirs at Homer field, or two distinct episodes of reservoir
charge during progressive burial of the same source bed. All of the gases
produced at York field in Ashtabula County, OH are highly mature and associated
with condensate. The two samples from Cottontree field in Roane County, WV
are post-mature dry gases. The 10 samples from Steuben and Chemung Counties
in NY also are post-mature and very dry.
- Homer Field, Elliott County, KY
- All three of the gas samples obtained from the Homer field are relatively
wet: methane ranges from 81.64 to 88.03 mol percent; ethane ranges from 4.72
to 7.81 mol percent; and propane ranges from 1.65 to 3.54 mol percent. Higher
homologues up through pentane are present in the gases. Nitrogen is notable
in the gases, ranging from 2.35 to 5.17 mol percent, but the BTU values are
1055 to 1125. The δ13C of methane in the wells we sampled
ranges from -39.5 permil to -44.41 permil, and corresponding δD of the
methane ranges from -143.4 permil to -206.9 permil (samples 19, 20, and 21
in Table 4). The δ13C distributions of methane, ethane, propane
and butane are normal in all three samples, i.e., the latter three homologues
are respectively enriched in 13C relative to methane. Thus, there
is no evidence of gas mixing in any of the samples.
- Carbon isotope variations in methane, ethane, propane, and butane in the
three samples reveal that the gases produced from the Wheeler 24 and Oliver
50 (T2) wells at Homer field are identical (Figure 15). This observation suggests
that these gases are produced from a compositionally-equilibrated reservoir.
The carbon isotope variations observed in gas from the Lawson Heirs (T1) well,
however, shows that it is distinctly different from the gas produced from
the Wheeler 24 and Oliver 50 (T2) wells (Figure 15). These data suggest that
the gas from the Lawson Heirs (T1) is not in communication with the gas in
the other two wells. We interpret this to indicate reservoir compartmentalization.
The data plots in Figure 15 also suggest two different source rocks for the
gases, or gases generated from the same source during distinctly different
episodes of burial and thermal maturation.
- York Field, Ashtabula County, OH
- The six gas samples collected from the York field also are somewhat wet:
methane ranges from 89.42 to 90.68 mol percent; ethane ranges from 4.45 to
5.04 mol percent; and propane ranges from 1.68 to 1.92 mol percent. Higher
homologues up through pentane are present in the gases. Condensate is produced
at York field. Nitrogen ranges from 1.25 to 1.63 mol percent and the BTU values
are 1101 to 1127. The δ13C of methane in the wells we sampled
ranges from -37.37 permil to -38.04 permil, and corresponding δD of
the methane ranges from -165.4 permil to -168.9 permil (samples 11 - 16 in
Table 4). The 13C distributions of methane, ethane, propane, and
butane are normal in all six samples; there is no evidence of gas mixing.
- Carbon isotope variations in methane, ethane, propane and butane in the
six samples show that the gases produced from samples 11 - 15 (see Tables
2 - 4) at York field are identical (Figure 16). This suggests that these five
gases are produced from a compositionally-equilibrated reservoir. The carbon
isotope variations in gas from the Mantell #1 well, however, show that it
is slightly different from the gas produced from the other five wells (Figure
16). This suggests that the gas from the Mantell #1 well is not in communication
with the gas in the other wells in York field. As at the Homer field in Kentucky,
we interpret this to indicate reservoir compartmentalization. This interpretation
supports that of Minken (2003) who suggested, on the basis of 3-D seismic
and production data, that the Mantell #1 well was drilled into a separate
compartment or fault block. The data plots in Figure 16 do indicate the same
source rocks for the gases produced at York field. The gas isotope data anticipate
the condensate production from late-mature, oil-prone source rocks at York
field (Figure 14).
- Cottontree Field, Roane County, WV
- We collected two samples of natural gas from the Cottontree Field in West
Virginia (samples 17 and 18, Tables 2 - 4). Both gas samples are very dry:
methane approaches 99 mol percent of the bulk chemical composition of the
samples, and only traces of higher hydrocarbon homologues occur in the gases.
Trace amounts of helium, nitrogen, carbon dioxide and hydrogen also occur
in the gases. The BTU value of both samples is 1018. The δ13C
of methane in the two Cottontree field samples is -35.12 and -35.43 permil,
with respective δD of -133.1 and -133.8 permil. These values indicate
dry gas generated from post-mature source rocks (Figure 14). The small amounts
of ethane present in the samples (0.692 - 0.875 mol percent) are depleted
in δ13C relative to the methane, i.e., they are isotopically
lighter than the methane. Such isotope reversals can indicate gas mixing in
the reservoir (Jenden and others, 1993; Laughrey and Baldassare, 1998), and/or
cracking of residual oils within the reservoir (Burruss and Ryder, 2004).
At present, we prefer the latter interpretation (see Laughrey, 2004), but
further work is needed to substantiate this mechanism.
- Glodes Corners Road Field, Steuben County, NY
- We collected gas samples from five wells in the Glodes Corners Road field
in Steuben County in the Finger Lakes district of New York state (samples
1 - 5, Tables 2 - 4). All five samples are relatively dry, with methane concentrations
of 94.97 to 97.74 mol percent, ethane concentrations of 0.383 to 0.683 mol
percent, and only minute traces of propane. Gas chromatography revealed no
gases higher than C3. Nitrogen is the second most abundant gas
after methane in the samples with concentrations of 1.85 to 2.41 mol percent.
BTU values of the Glodes Corners Road gases range from 981 to 1004. The methane
in all five samples is isotopically heavy: δ13C ranges from
-31.94 to -32.77 permil and δD ranges from -145.1 to -148.7 permil,
indicating post-mature dry gas (Figure 15). Ethane in the samples from Glodes
Corners Road field is depleted in 13C relative to methane. These
carbon isotope reversals are large, on the order of 6.88 to 7.25 permil (Table
4). Jenden and others (1993) interpreted such isotope reversals in New York
state gases as indicative of gas mixing in the subsurface. As at Cottontree
field in WV, however, these reversals might indicate the cracking of residual
oils in the reservoir (Burruss and Ryder, 2004).
- Keith and others (2003) proposed an abiogenic source for the gases produced
from Trenton and Black River carbonate reservoirs at Glodes Corners Road field.
Specifically, they suggested that the hydrocarbons were generated by serpentinization
of peridotite in failed intracratonic rifts or collision sutures in the basement
rocks. They integrated this mechanism of gas generation and migration at Glodes
Corners Road with a dolomitization and MVT mineralization model for the reservoir
carbonates in the producing field. To evaluate their hypothesis, we further
analyzed the samples from Glodes Corners Road field by looking at the noble
gas geochemistry of the gases. We measured a separate cut of the five samples
for 4He, 3He, 40Ar, 36Ar, 20Ne
and 84Kr, as well as methane, hydrogen, nitrogen and oxygen. These
data will be posted to the project web site soon. We are still analyzing these
data, but some preliminary interpretation of the helium data, in conjunction
with the hydrocarbon gas isotope data, is instructive.
- Jenden and others (1993) listed three analytical criteria for identifying
mantle-derived hydrocarbons in oil and gas fields:
- Methane δ13C > -25 permil.
- Isotopic reversals of the form methane δ13C > ethane
δ13C > propane δ13C.
- 3He/4He > 0.1 Ra (it is common to report 3He/4He
ratios as multiples of Ra, the atmospheric ratio which is equal to 1 X
10-5).
- The methane at Glodes Corners Road is isotopically heavy ( δ13C
= -31.94 to 32.77 permil), but not heavier than -25 permil. The gases do exhibit
isotopic reversals of the form methane δ13C > ethane δ13C,
but these can be interpreted as a result of mixing or cracking of residual
oil more reasonably than as a result of inorganic synthesis. Finally, the
3He/4He ratios of the Glodes Corners Road gases range
from 0.109 to 0.196. These values are close to radiogenic values and suggest
that most of the helium in the Glodes Corners Road field gases is of crustal
origin (Ozima and Podosek, 1998). Simple mass-balance calculations (see Jenden
and others, 1993) show that only 1.2 to 2.3 percent of the helium in the Glodes
Corners Road gases is of mantle origin. Some mantle helium in these gases
is not surprising considering the relationship of basement faults and related
fractures to the occurrence of these fractured and dolomitized carbonate reservoirs,
but the helium isotopes clearly show the dominance of crustal helium in the
gases. Our geochemical data do not support the hypothesis of Keith and others
(2003) and indeed refute it. Further interpretation of the noble gas data
we collected will be relevant to this discussion.
- Additional New York Gases
- We collected five additional gas samples from other producing fields in
the New York state Finger Lakes region (samples 6 - 10, Tables 2 - 4). These
fields are Muck Farm, County Line, Terry Hill South and Wilson Hollow. One
of these five samples was collected from a recent discovery near Corning,
NY, the #1 Andrews well. Like the Glodes Corners Road samples, these gases
are dry (97.81 to 98.63 mol percent methane with only traces of higher homologues).
Of these five samples, only the McAllister well in the Muck Farm field has
notable nitrogen (1.18 mole percent). Nitrogen in the other four samples ranges
from 0.46 to 0.65 mol percent. The BTU values of these additional five gas
samples range from 1011 to 1012. Isotopically, the methane in these samples
is some of the heaviest ever reported for the Appalachian basin (see Jenden
and others, 1993; Laughrey and Baldassare, 1998): δ13C ranges
from -29.56 to -30.10 permil and δD ranges from -149.2 to -151.2 permil,
indicating post-mature dry gas (Figure 15). Ethane in these samples is depleted
in 13C relative to methane on the order of more than 7.5 permil.
SAMPLE
NUMBER |
STATE |
FIELD |
WELL/API
NUMBER |
PRODUCING DEPTH |
| 1 | NY | Glodes Corners Road | Radigan/
3110121703-01 | |
| 2 | NY | Glodes Corners Road | Levandowski/
3110121688 | |
| 3 | NY | Glodes Corners Road | Fox/
3110121706 | |
| 4 | NY | Glodes Corners Road | Gray/
3110121592 | |
| 5 | NY | Glodes Corners Road | Covert1/
3110121689-01 | |
| 6 | NY | Muck Farm | McAllister/
3110122748 | |
| 7 | NY | County Line | Purvis/
3109722893 | |
| 8 | NY | Terry Hill | South Kimball/
3101522857 | |
| 9 | NY | Wilson Hollow | Jimerson/
3110122814 | |
| 10 | NY | | #1 Andrews/
3110123038 | |
| 11 | OH | York | Downes #1/ | |
| 12 | OH | York | Downes #3/ | |
| 13 | OH | York | Riffle/ | |
| 14 | OH | York | Dalin/ | |
| 15 | OH | York | York/ | |
| 16 | OH | York | Mantell/ | |
| 17 | WV | Cottontree | Parker/
470874250 | 10,680 ft. |
| 18 | WV | Cottontree | Epling/
470874261 | |
| 19 | KY | Homer | Wheeler 24/
1606390313 | 2409 ft. |
| 20 | KY | Homer | Oliver 50 (T2)/
1606387977 | 2688 ft. |
| 21 | KY | Homer | Lawson Heirs (T1)/
1606387821 | 2700 ft. |
| 22 | KY | Collin Fork | Milton | |
TABLE 2. Trenton/Black River reservoir gas samples.
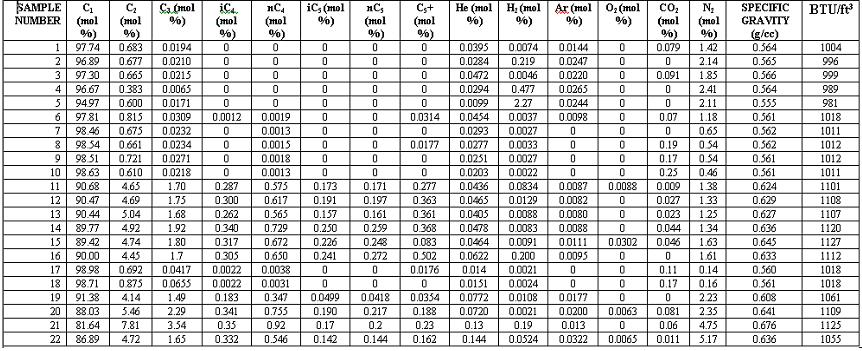
Table 3. Chemical Composition
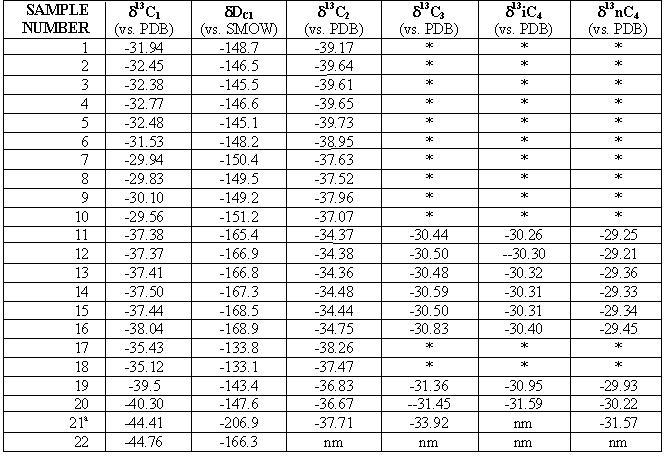
Table 4. Stable isotope composition (%o). * Denotes insufficient
gas in the sample for isotopic analyses. nm - not measured. 21a - data courtesy
of David Harris, Kentucky Geological Survey .
Future Gas Geochemistry Work
- Interpret noble gas data.
- Construct plots to quantify gas mixing in the reservoirs.
- Further investigate the use of isotope data to recognize compartmentalization and fault block mapping.
- Collect and interpret samples from Pennsylvania wells.
- Collect and interpret additional samples in WV, NY, OH, and possibly KY.
- Analyze selected isotopes in N2, H2S and CO2 in some Trenton/Black River reservoirs.
- Correlate gas geochemical data with source rock and bitumen geochemistry in different Trenton/'Black River reservoirs in the basin.
Task 6: Analysis of Production Data/Histories and Horizontal Well Technologies
Annual and monthly gas production data for West Virginia wells for 2003 have been added to the database, as well as annual production data for 2003 for New York wells.
Task 7: Database, GIS and Website Management
During this reporting period, many website and database issues were resolved by the West Virginia Geological & Economic Survey (WVGES) team that has taken the lead on this task. Soon, well data from West Virginia will initiate and populate the project "Wells Layer" for the base map. Some preliminary data have been received and will be added to the database early in the next quarter. A new rack-mounted server and necessary software (e.g., Windows 2003 Server, ServletExec® 5.0, and ArcIMS 9.0) were purchased, received and configured.
The project web server continues to evolve as the project progresses. The user/password authenticated website has a total of 38 activated members to date: 18 individuals from our industry partners and 20 research team individuals. Statistical coding and software (e.g., WebTrends™) were added to provide recording and analysis of user access and web site usage.
Table 5. General Statistics of Trenton Project
Website Visits Over Time Outside WVGES - 3rd Quarter, 2004
| Successful Hits For Entire Site | 3,654 |
| Average Hits Per Day | 39 |
| Home Page Hits | 6 |
| Pages |
| Page Views (Impressions) | 1,072 |
| Average Per Day | 11 |
| Dynamic Pages and Forms Views | 210 |
| Document Views | 862 |
| Visits |
| Visits | 122 |
| Average Per Day | 1 |
| Average Visit Length | 00:10:46 |
| International Visits | 5.74% |
| Visits of Unknown Origin (e.g., domain name undetermined) | 40.98% |
| Visits from United States (US) | 53.28% |
| Visitors |
| Unique Visitors | 53 |
| Visitors Who Visited Once | 36 |
| Visitors Who Visited More Than Once | 17 |
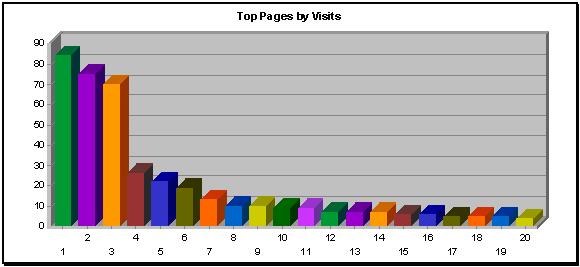
Table 6. Top Pages by Visits Outside WVGES - 3rd Quarter, 2004
| |
Visited Pages |
Visits |
% |
Ave. Time Viewed |
| 1. |
Trenton Gateway Page (index.html) |
84 |
20.19% |
00:00:26 |
| 2. |
Default Login Page (default.asp) |
75 |
18.03% |
00:00:21 |
| 3. |
Ancillary Login |
70 |
16.83% |
00:00:54 |
| 4. |
Technical Presentations from Meetings (technical_presentations.asp) |
26 |
6.25% |
00:02:57 |
| 5. |
Trenton Members Listing (members.asp) |
22 |
5.29% |
00:04:33 |
| 6. |
Logout Page (logout.asp) |
19 |
4.57% |
00:07:46 |
| 7. |
LAS Files (las.asp) |
13 |
3.13% |
00:01:01 |
| 8. |
Basemap Introduction (basemapintro.asp) |
10 |
2.40% |
00:01:21 |
| 9. |
Trenton Meeting Agenda - 9/9/2004 (090904meeting.asp) |
10 |
2.40% |
00:02:43 |
| 10. |
Basemap Page (basemap.asp) |
9 |
2.16% |
00:00:00 |
| 11. |
Contents Frame for Basemap Page (contents.asp) |
9 |
2.16% |
00:03:40 |
| 12. |
Default for Erroneous Login (accessdenied.asp) |
7 |
1.68% |
00:00:06 |
| 13. |
Web Server Default Page [non-Trenton] (index.html) |
7 |
1.68% |
00:06:58 |
| 14. |
Via IP Number (Web Server Default Page [non-Trenton] (index.html)) |
7 |
1.68% |
00:00:00 |
| 15. |
Semi-Annual Report, April 2004 (41856R01.asp) |
6 |
1.44% |
00:01:45 |
| 16. |
trenton/ dynamic code |
6 |
1.44% |
00:00:00 |
| 17. |
trenton/ dynamic code 2 |
5 |
1.20% |
00:00:21 |
| 18. |
Trenton Technical Proposal (technical_proposal.asp) |
5 |
1.20% |
00:00:09 |
| 19. |
Bibliography of Trenton Related Documents (bibliography.asp) |
5 |
1.20% |
00:01:50 |
| 20. |
Change Loge Page (changes.asp) |
4 |
0.96% |
00:01:17 |
| |
Subtotal |
388 |
93.27% |
00:00:34 |
| |
Other |
28 |
6.73% |
00:01:53 |
| |
Total |
416 |
100.00% |
00:00:57 |
Current technical issues that need to be resolved include: (1) preservation of session state between servers, (2) resolution of data-serving functionality between servers, and (3) secure mode (https) establishment for ArcIMS
The file transfer (FTP) server utilized by the Trenton Project was moved to a newer computer with more storage space, memory and recent upgrades. Secure FTP server software (SFTP) was installed on an offsite machine. This software is available for project use, in case we need an encrypted means for transfer of very sensitive data.
The ArcIMS (Internet Map Server) feature of the website underwent the most development during this report period. WVGES designed and implemented an interactive mapping website for the project, utilizing and augmenting shapefiles and ancillary information provided by the Ohio Geological Survey (regional base maps) and by the Appalachian Region-PTTC. This site is accessible only from the project web server.
Project information, such as the location of preliminary cross section lines, has been added to the ArcIMS base map and it awaits further data and development.
Task 8: Play Book Compilation and Management
The compilation of the play book will occur in the final reporting period (April 1, 2005 - September 30, 2005) as each of the individual task teams completes their assignments.
The Project Manager and Senior Management Team had several goals during the initial reporting period. One goal was to get the final subcontract and budget in place with one of our research team members. This would allow them to be paid for their research efforts.
Another management goal was to cooperate with the Appalachian Region of the Petroleum Technology Transfer Council to organize and host a workshop on the Trenton-Black River Play. In conjunction with this, a third goal was to organize and hold the third meeting of the full Research Team on the following day. A final goal was to schedule back-to-back meetings of the Research Team and the entire Trenton-Black River Appalachian Basin Exploration Consortium in September near the Pittsburgh airport.
Early in the reporting period, the fifth and final subcontract was received from one of the state geological surveys. This completed the formation of the Trenton-Black River Research Consortium, with four state geological surveys, one state museum and 17 oil and gas producers under the same membership agreement.
On June7th, the West Virginia Geological Survey and West Virginia University hosted a very successful Trenton-Black River Play workshop in Washington, Pennsylvania. All of the members of our research team and several industry partners were present. The following day, a meeting of the research team was held in the offices of the West Virginia Geological Survey near Morgantown. All research team members were in attendance. The primary goal of the Project Manager for this meeting was to review the status of each task team and to ensure that full cooperation among all task teams was being achieved.
On September 8th, the full research team met once again at the Embassy Suites Hotel near the Pittsburgh airport. The main purpose of this meeting was to allow each of the research team members to have the opportunity to critique presentations by each task team leader. This process continued after all presentations had been made, resulting in a series of concise presentations for the meeting of the entire Trenton- Black River Research Consortium the following day.
More than 50 percent of our company partners were in attendance the next day to hear the refined presentations. Overall, the reports were very well received, with few suggestions and no criticisms received. During follow up discussions with our company partners, many favorable comments were received regarding the scope and quality of our research.
(To Table of Contents)
CONCLUSIONS
From the Structural and Seismic task:
- Interpretation of available seismic data does not support the extension of the Rome Trough into New York State.
From the Petroleum Geochemistry task:
- Gases produced from Trenton/Black River reservoirs in the Appalachian basin are early mature to post-mature. Maturity appears to correlate with burial and tectonic history.
- Gases produced at the Homer Field in Elliott County, KY are compartmentalized and originated from at least two different sources.
- Gases produced at York Field in Ashtabula County, OH also come from at least two discrete reservoir compartments; isotope geochemistry may reflect reserve potential.
- Gases produced from Trenton/Black River reservoirs in New York are post-mature, and exhibit isotopic reversals. Reversals may be due to mixing or cracking of gases from residual oils in the reservoirs.
- Noble gas geochemistry of the NY gases indicates a predominantly crustal origin, with a minor 3He component derived from the mantle.
- Many Trenton/Black River gases produced in KY, OH, and NY contain notable nitrogen (1.18- 5.17%). This might be a magmatic component.
(To Table of Contents)
REFERENCES
Beardsley, R.W., and M.S. Cable, 1983, Overview of the evolution of the Appalachian
 		basin:  Northeastern Geology, v. 5, p.137-145.
Burruss, R. and R. T. Ryder (2004), Geochemistry of natural gases along a down-dip
  		cross-section through the Lower Silurian Regional Gas Accumulation, central
  		Appalachian basin, United States (abst.): AAPG Eastern Section Meeting, 2004,
  		Columbus, Ohio, p. 67.
Harper, J.A., 1989, Effects of recurrent tectonic patterns on the occurrence
  		and development of oil and gas resources in western Pennsylvania: Northeastern
  		Geology, v. 11, p.225-245.
>Harris, D.C., et al, 2002, Rome trough consortium: Kentucky Geological Survey,
  		Open File Report OF-04-06.
Hoefs, J. (1997). Stable isotope geochemistry (4th Edition), Berlin, Heidelberg,
  		New York: Springer-Verlag.
Jenden, P. D., D. J. Drazan, and I. R. Kaplan, 1993, Mixing of thermogenic
  		natural gases, northern Appalachian basin: AAPG Bulletin, v. 77, p. 980 - 998.

Keith, S. B., M. M. Swan, and J. C. Rasmussen, 2003, Integrated hydrothermal
  		dolomite (HTD) gas conceptual exploration model and identification of an unrecognized
  		major Mg-hydrocarbon source (abst.): AAPG National Meeting, 2003.
Laughrey, C. D. and F. J. Baldassare, 1998, Geochemistry and origin of some
  		natural gases in the Plateau Province, central Appalachian basin, Pennsylvania
  		and Ohio: AAPG Bulletin, v. 82, p. 317 - 335.
Ryder, R.T., 1992, Stratigraphic framework of Cambrian and Ordovician rocks
  		in the central Appalachian basin from Lake County, Ohio, to Juniata County,
  		Pennsylvania: U.S. Geological Survey.
Schoell, M., 1983, Genetic characteristics of natural gases: AAPG Bulletin,
 		 v. 67, p. 2225-2238.
Schoell, M. and others, 1993, Isotope analyses of gases in gas field and gas
  		storage operations: SPE Gas Technology Symposium, Calgary, Alberta, Canada,
  		28 - 30 June, 1993.
Shumaker, R.C., 1996, The atlas of major gas plays: Roen and Walker, ed., West
  		Virginia Geological Survey, Publication V-25, Plates 2A, 2B and 2C, p. 17-21.
Wilson, J.L., 1975, Carbonate facies in geologic history: Springer Verlag,
  		New York, 471 p.
(To Table of Contents)
LIST OF ACRONYMS AND ABBREVIATIONS
(To Table of Contents)
APPENDICES
Examples of Petrographic Descriptions
The following examples of petrographic descriptions were selected to illustrate the nature of our work in progress. The first - a thin section from the McKnight #1 well in Mercer County, PA - shows the kinds of sedimentary and diagenetic information we obtain from non- dolomitized or only slightly dolomitized Trenton and Black River carbonates. The second example - a thin section from Price #1 well in Burlington County, OH - shows how we describe completely dolomitized samples.
Example 1 from the McKnight well in Mercer County, PA:
6843.6 ft. (2085.9 m): medium light gray (N6)
skeletal
grainstone (unsorted biosparite)
- Skeletal Grains:
- Brachiopods
- Echinoderms (crinoid fragments)
- Trilobite fragments
- Bryozoans
- Red algae (Solenopora sp.)
- Ostracode fragments
- Mollusk fragments
- Cephalopod fragments
- Skeletal grain sizes range from 0.03mm to 2mm; the average grain
size is approximately 0.15mm (poorly sorted, fine calcarenite).
- Micritization: micrite envelopes and subordinate encrustations
are evident on many skeletal grains, particularly on trilobite, crinoid, and
brachiopod fragments. Irregular protrusions of micrite developed towards grain
interiors were formed by microborings; bulges of thicker micrite orientated
away from the grains are encrustations. Micrite also fills some brachiopod
punctae. The contacts between micrite encrustations/envelopes and unaltered
skeletal material are irregular.
- Matrix: none.
- Cements:
- Bladed to equant calcite rinds: very small (0.001 - 0.03 mm),
uneven but mostly isopachous crystals, with low length to width ratios,
form crusts on skeletal grains.
- Syntaxial calcite overgrowths of echinoderms: these zoned
calcite cements formed in optical continuity with crinoid substrates;
this cement also fills intraparticle voids within crinoid skeletal grains.
- Intraparticle, coarse sparry calcite: calcite spar fills zooecia
in bryozoan fragments, and in some rare ostracode cavities.
- Equant blocky calcite: drusy mosaic of mostly equidimensional,
blocky calcite crystals fills intergranular voids; crystal size increases
from the margins of pores (~0.1 mm) towards the pore centers (0.8 mm+);
these calcite cement crystals display compositional zoning.
- Porosity: very low (<4% from logs); pore types include
low intercrystal and interparticle porosity, and minor intraparticle and moldic
porosity within bryozoans and crinoid fragments, respectively.
- Standard Microfacies (Wilson, 1975): SMF 11 or 12; winnowed
platform edge sands; area with constant wave action at or above wave base
(11); certain types of organisms dominate; slopes and shelf edges (12).
- Compaction and Deformational Features: minor fractures
cross grain and cement boundaries; some minor stylolites.
- Diagenetic Sequence:
- Micritization
- Isopachous calcite rinds on skeletal grains; syntaxial overgrowths
- Pore-filling equant blocky calcite
- Notes:
- Brachiopods: grains are large (mm- to cm-size) skeletal fragments; most exhibit wavy, parallel laminated or fibrous shell structure sub parallel to the outer margin of the shells; some display a crenulated shape; most brachiopods are impunctate, but some have punctate structures and some show oblique pseudopunctae; spines are common in the samples.
- Echinoderms (crinoid fragments): 0.3 to 0.6 mm grains; crinoid fragments exhibit single crystal extinction and uniform granular microtexture; many display optical continuity with calcite overgrowths (syntaxial rim cement). Some rare large crinoid fragments show a longitudinal stem section (columnals); in the latter instance, micritization occurred along the axial canal and between segments prior to the precipitation of syntaxial overgrowth cement.
- Trilobite fragments: also large mm-scale grains; most are boomerang- or shepherd's crook-shaped carapace fragments (broken from thoracic segments of sclerites as the animals disarticulated); extinction bands sweep through individual grains as the stage is rotated under cross-polarized light; this extinction pattern reflects the orientation of tiny homogeneous prismatic crystals perpendicular to the carapace wall; the trilobite fragments appear slightly brownish due to chitinous and organic matter.
- Bryozoans: 0.3 to 1.5 mm grains composed of numerous stems and fronds;
stems display somewhat elliptical to box-shaped zooecia; fronds show elongate
zooecia; both stems and fronds have fibrous wall structures; Trepostomes
and Cryptostomes are abundant and readily recognizable, particularly the
Ptilodictyina bryozoans of the latter order such as Stictopora fenestrata.
Example 2 from the Price #1well in Mercer County, OH:
- 1194 FT. (363.9 m):
- medium light gray (N6), coarsely crystalline dolostone: polymodal,
with crystal sizes ranging from 0.1 to 3.5 mm (x = 0.6 mm); planar-s
to planar-e dolomite texture; mimically and nonmimically replaced
skeletal fragments and ghosts of skeletal fragments are apparent (brachiopods,
echinoderms, and bryozoans); irregular solution seams, with insoluble residue,
pyrite, and medium crystalline planer-e dolomite that postdates pressure solution;
visible porosity is low (~ 5%) and consists of intercrystalline, vuggy, and
crystal-moldic void types present as small mesopores 0.07 to 1.3 mm in size;
late-stage pyrite partially replaces some dolomite, and partially fills pores;
void-filling dolomite mimically replaces equant calcite rinds and syntaxial
calcite overgrowths, and probably replaces a precursor carbonate (calcite?)
cement (UV fluorescence may help resolve this); undulose extinction under
cross-polarized light, some slightly curved crystal faces, and sulfide inclusions
suggest this rock is a HTD.
- 1194.5 ft. (364 m):
- medium light gray (N6) coarsely crystalline dolostone; polymodal,
with crystal sizes ranging from 0.1 to 1.5 mm (x = 0.5 mm); planar-s
to planar-e dolomite texture; undulose extinction of dolomite crystals
under cross-polarized light, and many curved crystal faces indicate HTD, indeed,
the void-filling dolomite around most vugs exhibits the classic "spearhead"
geometry of saddle dolomite; sphalerite and pyrite replace some HTD crystals;
dolomite mimically replaces some grains, and abundant ghosts of brachiopod,
bryozoan, and crinoid fragments suggest a former skeletal grainstone; visible
porosity is about 5%, and consists of intercrystalline, vuggy, and crystal-moldic
voids present as small to large mesopores 0.06 to 2 mm in size; some vugs
and crystal- moldic pores are lined with microcrystalline calcite cement which,
in some instances, exhibits a meniscus fabric - this late-stage calcite cement
probably formed in association with selective leaching and dedolmitization
of HTD crystals; pyrite replaces some of the late-stage microcrystalline calcite
cement as well as some dolomite. calcite cement as well as some dolomite.