1.3 Data Deliverables Access, Organization and Management
Data deliverables for the Utica Shale Play Book Study include not only the text, tables, figures and appendices of this final report but also the raw datasets, analyses, and results utilized by the Research Team members. All study-specific data, whether compiled from legacy sources or derived specifically for this work, have been organized and assimilated into a Geographic Information System (GIS) database and interactive mapping application, as well as a searchable Oracle database that is available via the project website. These data may be accessed using the following links/web addresses:
(ed.: This web site.)
Appalachian Oil and Natural Gas Research Consortium Website (links to Utica site):
http://aongrc.nrcce.wvu.edu
1.3.1 Interactive Map Application
The Utica Shale Play Book Study’s interactive map application utilizes ESRI ArcGIS Server technology and is designed to allow users to visualize geologic data in spatial context (Figure 1-1). Data include the following:
- Wells
- With Supplemental Data1
- Digitized Well Logs
- Scanned Well Logs
- Source Rock Analyses
- Total Organic Carbon (TOC) Data
- Core Photographs
- Scanning Electron Microscopy (SEM) Images-Data
- Thin Section Images
- Thin Section Descriptions
All Wells with Data (via Downloads Page of this website) |
- With Formation Tops2
- Upper Ordovician
- Kope
- Utica
- Point Pleasant
- Lexington/Trenton (includes Logana and Curdsville members)
- Black River
- Cross-Sections3
- Maps1
- Faults
- Kope
- Utica
- Point Pleasant
- Lexington/Trenton (includes Logana and Curdsville members)
- Black River
- Play Areas
- Utica
- Ordovician Outcrops
1 Data obtained from Utica Shale Project FTP server.
2 Data obtained from Utica Shale Project Petra® file.
3 Data obtained from Trenton-Black River Project.
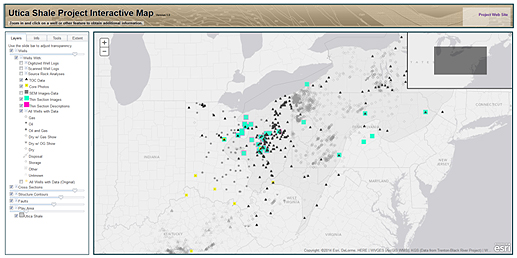
Figure 1-1. Screen-shot display of the Study’s secure interactive map application, which was developed using ArcGIS Server. All wells with files or documents are shown along with wells having TOC data, core photos and thin section data.
Selecting a well or area on the map will result in a “Layer Info” window that allows users to see the different data types available for the selection (Figure 1-2). Each data type contains a secure link or links to the project database where the data may be retrieved. Links to the well file document search system and any relevant files or documents are available for “Wells With Supplemental Data” layers (Figure 1-2). Also, links to cross-section images are available for “Cross-Section Line” layers. The application provides the ability to switch base maps as well as basic navigation and print tools.
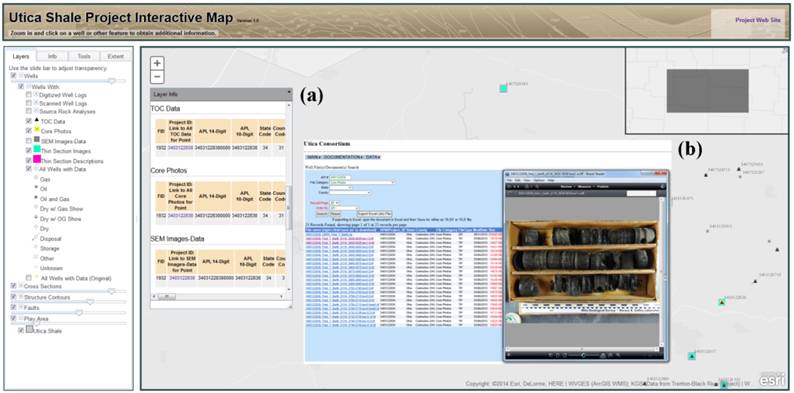
Figure 1-2. Screen-shot display showing the Study’s interactive map application. (a) Popup window with additional information, which is accessed by clicking on a well or other feature in the interactive map. (b) Well file document search system window and a core photo. Search system and files or documents (e.g., core photos) are accessed from the map application using links in the popup window.
1.3.2 Play Book Study Website
Note: Some website design and arrangement may have changed since the writing of this report.
The Utica Shale Play Book Study website is the main source of data collected and generated for the project. This website runs on a Microsoft Windows server using IIS 7.0 and SSL encryption.
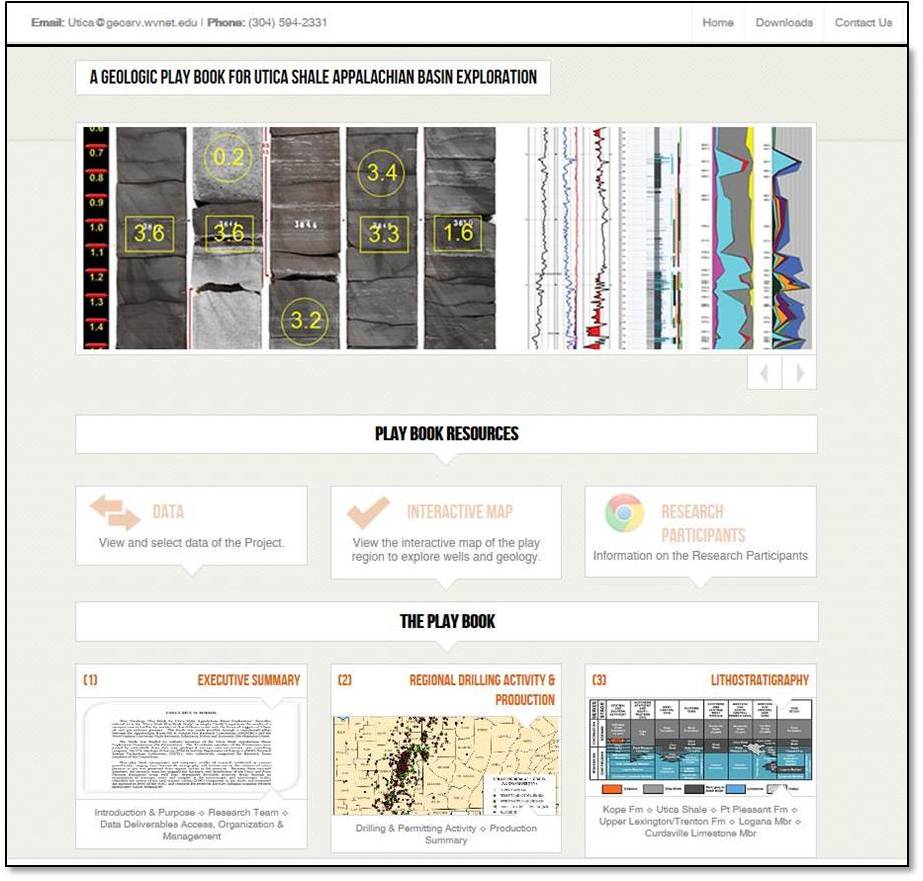
Figure 1-3. Utica project website homepage.
The website contains project information and data under three main categories: “Data”, “Interactive Map” (See section 1.3.1 for details) and “The Play Book” (Figure 1-3). Each chapter of the final project report is accessed via its own section of “The Play Book”. Links to the corresponding appendices are embedded within the text, enabling users to access related data as they read through the body of the chapter.
Figure 1-4. Within each chapter of the Utica Play Book, links to corresponding appendices are embedded within the text, allowing users to access the referenced data as they read through the chapter.
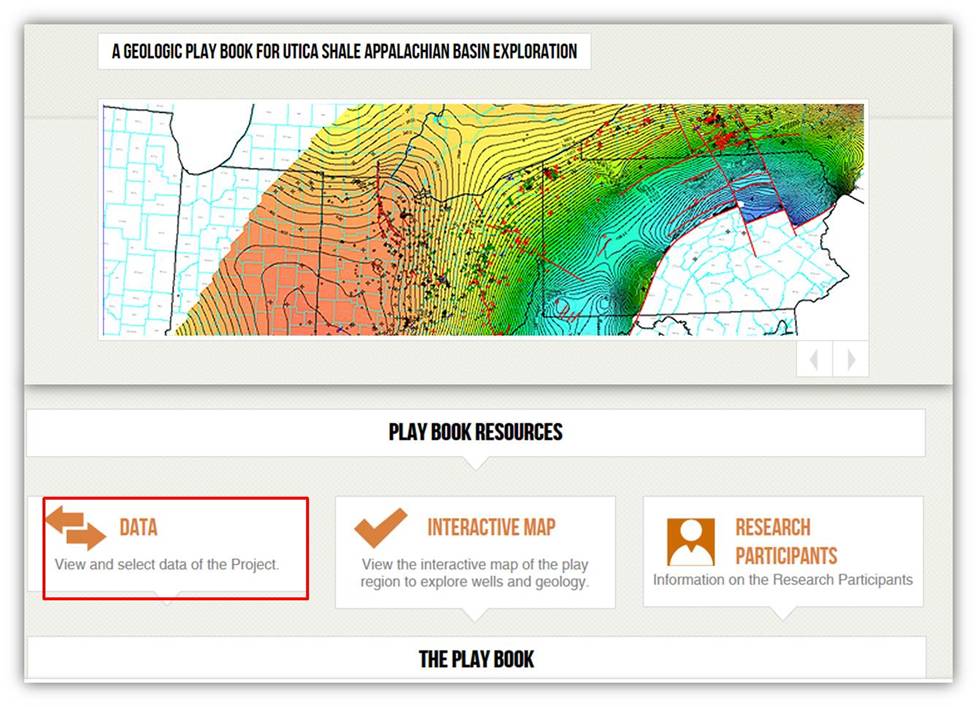
Figure 1-5. Screen-shot display of the Utica project home page with “Data” tab highlighted (http://www.wvgs.wvnet.edu/Utica).
The "Data" section of the website contains all data collected, processed and analyzed during the course of the project’s research. Website users may access these data via a well document file search, which links to the project database (Figure 1-5). This document search allows users to create a custom search of the project database. A search may utilize one or more of the following criteria:
- API number
- File category (see Table 1-2 for file category types)
- State
- County
Results of the data search may also be exported to Excel, where the data are able to be further sorted (Figure 1-6). Hyperlinks to the individual files are embedded in the Excel file, which allows users to link back to the project webpage to retrieve the data without performing a duplicate search.
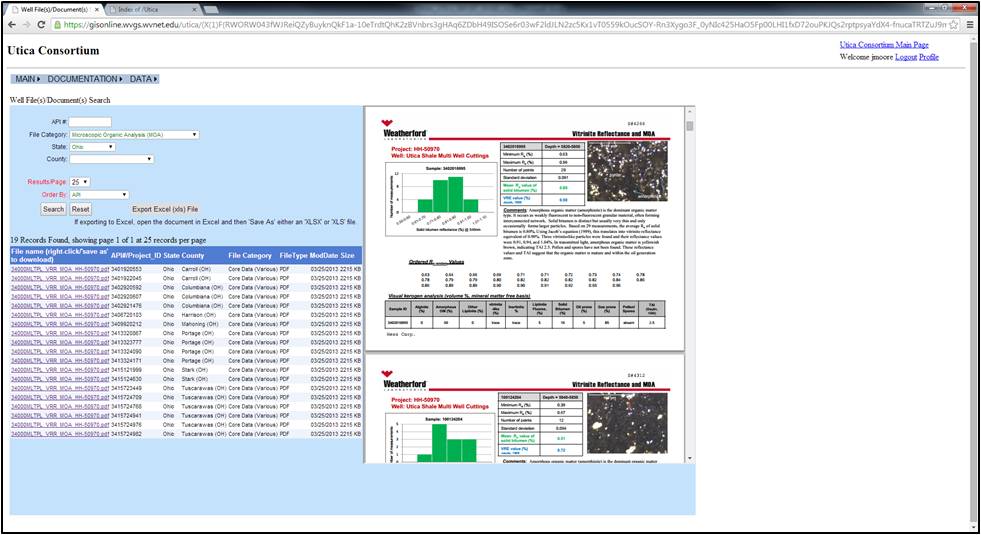
Figure 1-6. Example of a customized Utica database search (Microscopic Organic Analysis, Ohio) with results. The results may also be exported to an Excel file, which allows further sorting of the data. The Excel file also contains links back to each file, which eliminates the need for duplicate searches across multiple work sessions.
1.3.3 Data Management
The Consortium database utilizes Oracle 11g technology. The database was initially populated with metadata of the documents uploaded by research team members in fulfillment of the requirements of Task 1 (Organization of Existing Data) and has been periodically updated as new data have become available. This searchable database is now available via the project website (http://www.wvgs.wvnet.edu/utica (ed.: This website). All data are organized by API number, as available. If an API number was not available, a Project ID was generated for the well or document.
The folder structure within the Consortium database was initially organized so that each well document file would be classified within a single file category (e.g., Digital Logs, Sample Descriptions, etc.). This file category would serve as the root of the directory folder, with subfolders for each state within the root category. As organization of the data progressed, it became apparent that a given document may contain several data types and would need to be cross-listed within the database. Table 1-2 lists the file categories, abbreviations, and document counts for the database (current as of July 9, 2014).
| FILECATEGORYCODE | FILECATEGORYLONG | KY | NY | OH | PA | WV | TOTAL |
|---|
| BIOSTRAT | Biostratigraphy | | | 12 | | | 12 |
| CRPH | Core Photos | 146 | | 1046 | | 62 | 1254 |
| CRPHZ | Core Photos Zipped | | | 5 | | | 5 |
| CSP | Crushed Stone Properties (CSP) | | | 1 | | | 1 |
| CTDAT | CT Scan Data | | | 11 | | | 11 |
| CTIMG | CT Image | | | 220 | | | 220 |
| CTIMGZ | CT Zipped Images(CTIMGZ) | | | 9 | | | 9 |
| DLOG | Digitized Logs | 2 | 501 | 170 | 112 | 29 | 814 |
| ELOG | Scanned Logs | | 1007 | 31 | 164 | 120 | 1322 |
| FIR | Fluid Inclusion Report | | | 1 | | | 1 |
| GEOCHEM | Geo Chem | | | 2 | | | 2 |
| ISO | Isotopes | 2 | | 10 | | | 12 |
| LOGT | Log Tops | | | | 2 | | 2 |
| MICP | High Pressure Mercury Injection Porosity (MICP) | | | 12 | | | 12 |
| MNRLGY | General Mineralogy (MNRLGY) | | | 8 | | | 8 |
| MOA | Microscopic Organic Analysis (MOA) | | | 19 | | | 19 |
| OTHR | Other Well Documents | | 104 | 27 | 22 | | 153 |
| RCA | Routine Core Analysis (grain size) (RCA) | | | 8 | | | 8 |
| RKMECH | Rock Mechanics | | | 9 | | | 9 |
| ROHIST | Ro Histograms | | | 10 | | | 10 |
| SEM | Scanning Electron Microscope (SEM) | | 144 | 348 | 444 | | 936 |
| SEMZ | SEM Zipped Images (SEMZ) | | | 5 | 14 | | 19 |
| SMDS | Sample Descriptions | | 72 | 19 | 1 | | 92 |
| SRA | Source Rock Analyses (SRA) | | 53 | 263 | 12 | 15 | 343 |
| TOC | Total Organic Carbon (TOC) | | 53 | 260 | 12 | 15 | 340 |
| TRA | Tight Rock Analysis (TRA) | | | 23 | | | 23 |
| TSDESC | Thin Section Description | | | 29 | | | 29 |
| TSIMG | Thin Section Image | | | 878 | 53 | | 931 |
| TSIMGZ | Thin Section Zipped Images | | | 7 | | | 7 |
| VRR | Vitrinite Reflectance Report | | | 59 | 17 | | 76 |
| XRD | X-Ray Defraction (XRD) | | 10 | 138 | 68 | 13 | 229 |
| XRF | X-Ray Fluorescence (XRF) | | | 6 | | | 6 |
Table 1-2. Consortium file categories, abbreviations and number of files per state. Data categories and counts are current as of July 9, 2014.
Due to the necessity of cross-listing a single document file under several categories, a naming convention was devised that would support multiple classifications. Each well or document file is first named according to API number (10- or 14-digit). If an API number is unavailable (e.g., outcrop sections, water wells, etc.), the file is given an internal Project ID by the following convention:
Naming Convention: 2-digit state code/3-digit county code/5-character identifier
Example: 37027_OC12 (Pennsylvania, Butler County, Outcrop Sample 12)
For all other wells, the file naming convention leads with the API number. The leading API number/Project ID is then followed by the code for the file category or categories under which the data are classified. For a standard file containing information on a single well or sample, the following naming convention is used:
Naming Convention: API number or Project ID_File Type Code(s)_Optional Description
Example: 34003636910000_SRA_TOC_BP_Chemical_Plant_Well_4.xls
As of July 9, 2014, there were 5696 files organized under this naming convention. In addition to these files, there were an additional 35 files that contain data for multiple wells. These files, which are often final results of data analyzed by service companies or consultants, can contain results for many different wells or samples. For these document types, the following naming convention is used:
Naming Convention: 2-digit state code/000/MLTPL_File Type Codes_Optional Description
Example: 34000MLTPL_SRA_TOC_XRD_OvertonEnergy.pdf
Individual wells contained in the file are stored in a second table, which is linked by the file name, allowing the user to search by any of the individual API numbers/Project IDs contained within the multiple well file.
As the data collected, generated, and interpreted by the research team became finalized, new file categories were created and populated with project results. In addition, a general file with all header data was created, allowing users to import project wells into various subsurface mapping programs. For convenience when downloading multiple image files (e.g., thin-section images, core photographs or SEM images), additional zipped folders that contain all the images have been created. The resultant files are very large, but allow users to retrieve all images without having to download large numbers of individual image files.