9.1 Remaining Recoverable Resources
The first portion of the resource assessment task followed the probabilistic approach developed by the USGS and used in a 2012 assessment of undiscovered oil and gas resources of the Utica Shale (Kirschbaum and others, 2012). With this approach, the geologist defines the geographic limits of an Assessment Unit (AU), which is an area with expected oil or gas resources with generally the same or similar thermal maturity, organic content, lithology, source rock and trapping mechanism.
Input parameters for calculating the resource are AU area, drainage area per well, percentage of the unit untested, percentage of untested area in sweet spots, success ratios and estimated ultimate recoveries (EURs) for both sweet spot and non-sweet spot area, and co-product ratios (gas-to-oil and NGLs-to-gas ratios within oil accumulations, and liquids-to-gas ratio for gas accumulations).
For each of these parameters, the geologist does not specify a single number, but rather estimates of expected minimum, maximum and average or mode, thus defining a distribution.
The actual resource assessment calculations take place through a Monte Carlo procedure, that is, through repeated sampling of the distributions through a large number of trials (1000 or more).
These independent trials are used to calculate the F5, F50 (Median), F95 and average volumes of oil and gas in the AU. The procedure is described in more detail in Charpentier and Cook (2010).
Calculations are made through a spreadsheet available for download from the USGS, which requires the commercial package @Risk™ to do the Monte Carlo computations.
Input parameters for computations are in Appendix 9-A  (PDF, 298.67 KB; 3 pages).
9.1.1 Definition of Assessment Unit Sweet Spot Areas
Within each assessment unit, we calculated percentage of the undiscovered area lying within sweet spots from maps of well locations, cumulative production from each well and geographic trends in thermal maturity. Thermal maturity data collected during this project were combined with published data from the USGS, converted to vitrinite reflectance equivalent through a regression equation and mapped (Figure 9-2). We were particularly interested in delineating a gas prone region, an oil-prone region and the primary area of wet gas. Two indicator variables were created, the first by setting all reflectance values greater than 1.1 to “1” and those less to “0”, and the second by setting values greater than 1.4 to “1” and the balance to “0”, these two thresholds being the generally-accepted ones for defining the oil, wet gas and dry gas windows of maturity. Kriging of these two indicator variables provides local probabilities that an observed reflectance will exceed the respective threshold (Figure 9-3). Overlaying the contoured probability of exceeding the 1.1 threshold with a map of oil cumulative production (Figure 9-5), we drew a map of minimum and maximum sweet spot (Figure 9-5).
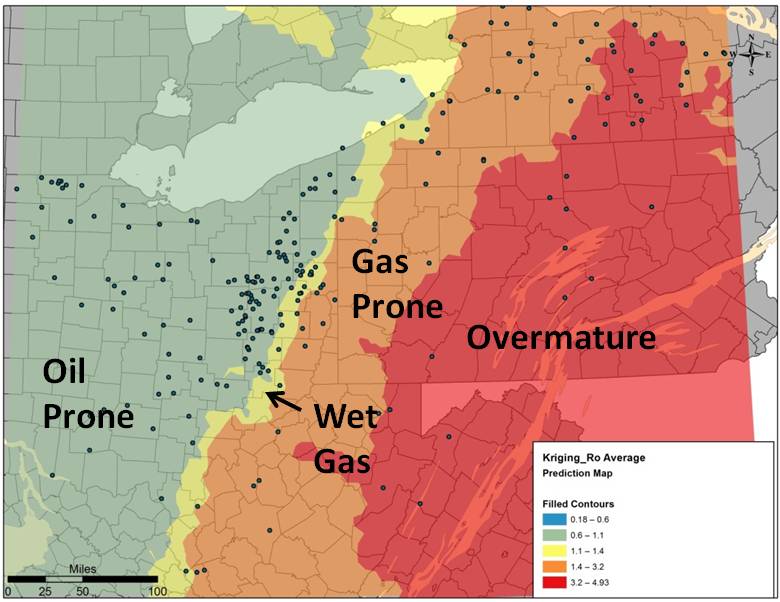
Figure 9-2. Contour map of vitrinite reflectance calculated from conodont alteration index, pyrolysis and bitumen reflectance data.
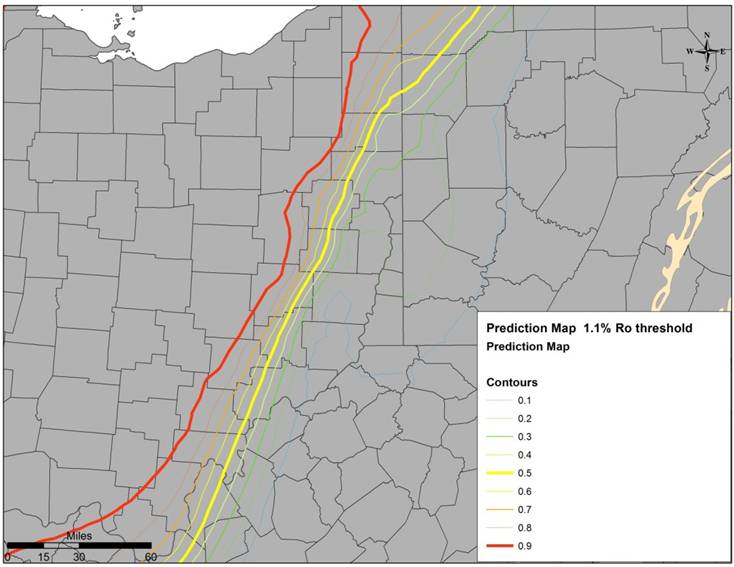
Figure 9-3. Contour map of probability that calculated vitrinite reflectance exceeds 1.1.
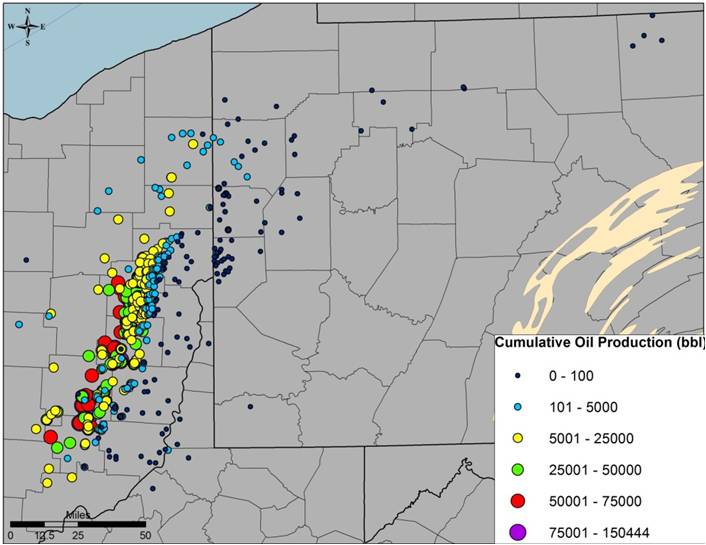
Figure 9-4. Producing oil wells by total cumulative production.
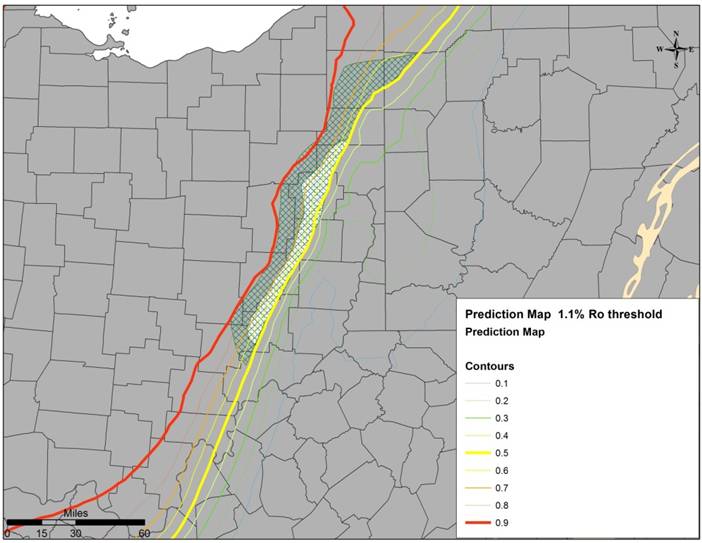
Figure 9-5. Geographic extent of minimum and maximum Oil AU sweet spot used in resource assessment.
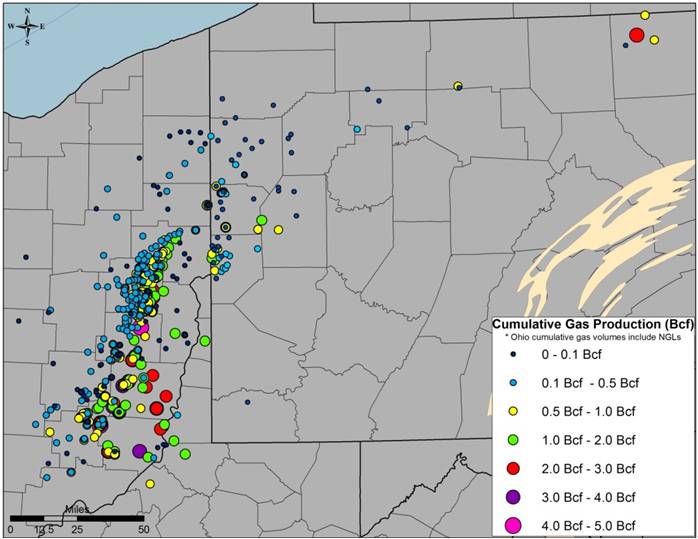
Figure 9-6. Producing gas wells by total cumulative production.
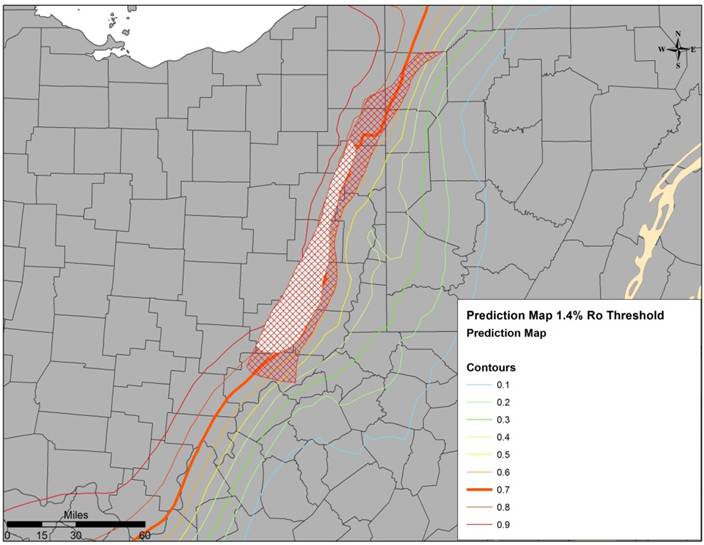
Figure 9-7. Geographic extent of minimum and maximum Wet Gas AU sweet spot used in resource assessment.
Similarly, contoured probability of exceeding the 1.4 reflectance threshold and with maps of oil (Figure 9-4) and gas production (Figure 9-6) were used to delineate extents of the minimum and maximum wet gas sweet spots, as well as the extent of the wet gas AU as a whole (Figure 9-7). Because natural gas liquids were not split out from gas in data available to us from Ohio, we could not map wet gas trends directly.
Minimum and maximum extents of the gas sweet spot for the purpose of the resource assessment were based on locations of producing gas wells in the gas prone region. Areas for each of the assessment units and respective sweet spots were calculated from the resulting map shown in Figure 9-8.
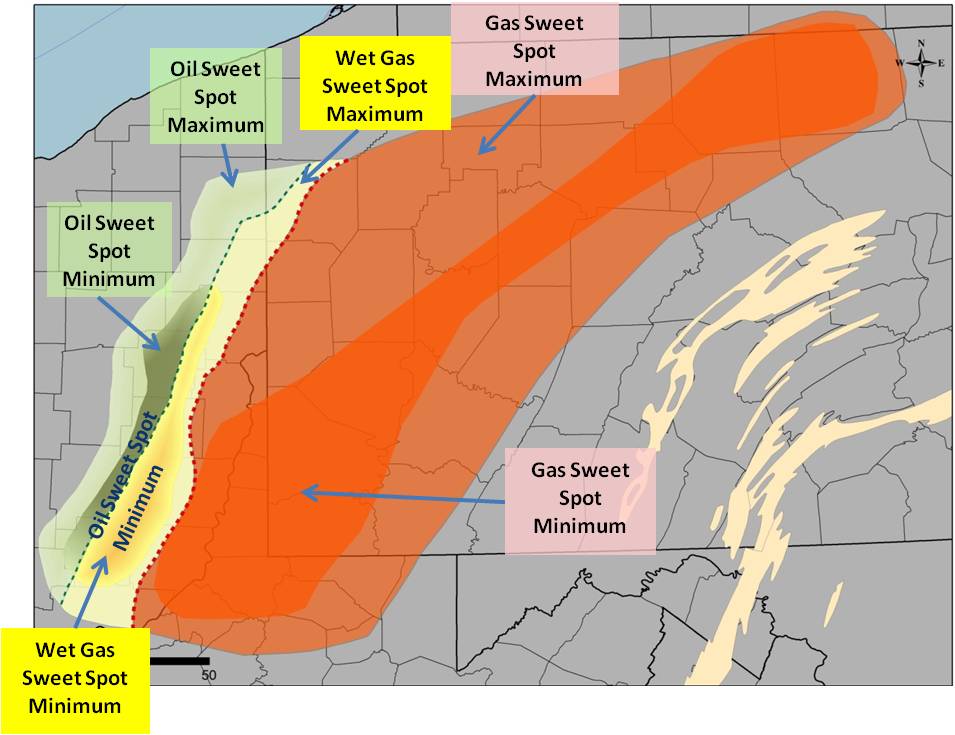
Figure 9-8. Geographic extent of minimum and maximum sweet spots used in resource assessment.
9.1.2 Estimated Ultimate Recovery
Annual production data for 2011-2014 from Pennsylvania and Ohio graphed by year in production (1st, 2nd, 3rd and 4th) showed a lot of variation with no consistent trend in medians (for example, Figure 9-9). As the play develops, one can expect an increase in productivity as the best areas are discovered and well completion strategy improves. For instance, wells with four years of data were the earliest drilled and can be expected to have below average performance compared with wells drilled in subsequent year, for which less data are available. Therefore, we examined subsets of wells based on the number of years of data available (i.e., grouped by year of completion), giving us four sets of medians for fitting a model. Note that medians for wells completed in 2012, 2013 and 2014 were shifted six months toward the origin to reflect the average number of months online, and medians for wells completed in 2011 were adjusted downward nine months because the average period of production for these wells was about three months.
A harmonic model of decline was fitted using the curve for wells completed in 2011 as a guide to shape and median production from wells completed in 2014 as an indicator of median production to expect (Figure 9-10). The model was used to compute cumulative production out to forty years as an EUR. The fifth percentile of production for wells completed in 2014 was used as a minimum within the sweet spot, and a maximum was fitted by eye from the range of outcomes for wells in their first and second year of production. Final results expressed as median resource were relatively insensitive to changes in the maximum EUR compared with changes in median EUR, offsetting the relatively high uncertainty in maximum EUR to expect.
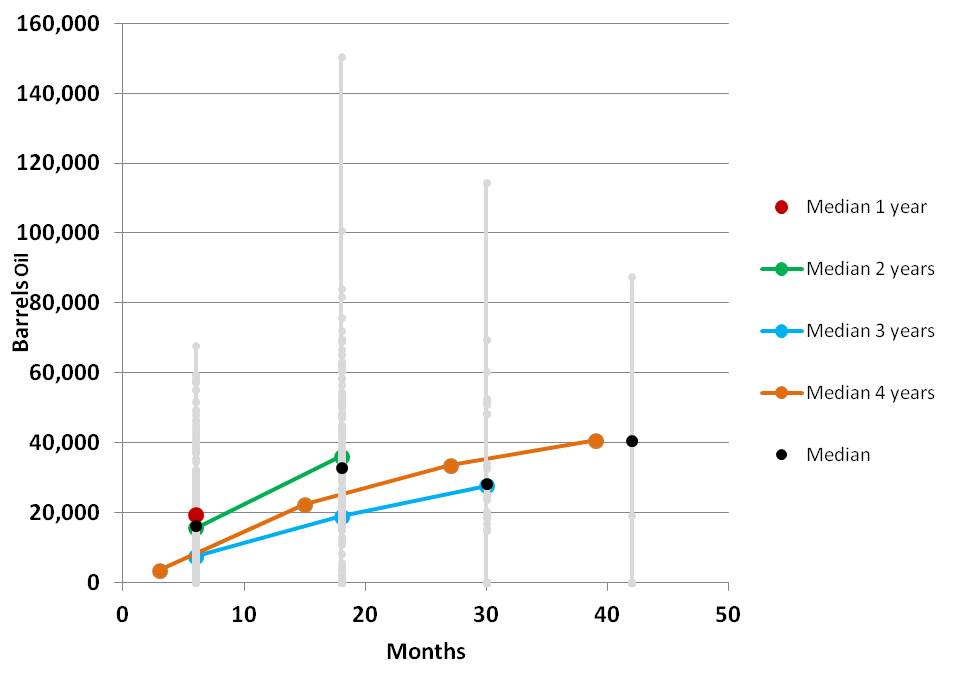
Figure 9-9. Cumulative production by months online (light gray dots), median values (black filled circles) and medians for wells in the oil sweet spot grouped by number of years of production data available ranging from 1 to 4 years.
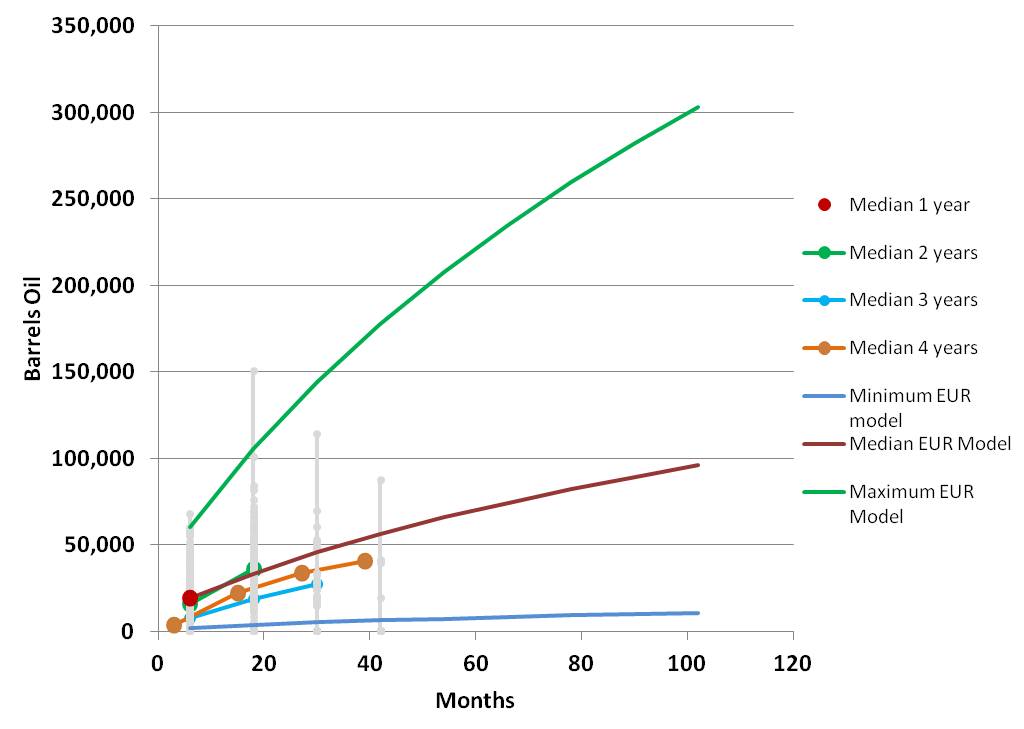
Figure 9-10. Cumulative production by months online (light gray dots) and medians for wells in the oil sweet spot grouped by number of years of production data available ranging from 1 to 4 years, and fitted models for calculating minimum, median and maximum estimated ultimate recovery.
The same procedure was followed for the oil, wet gas and gas assessment unit sweet spots (Table 9-1 to 9-3). For areas outside the sweet spots in each assessment unit, the median EUR was set at the value corresponding to the lowest five percentile of production from wells that went online in 2014, the minimum at the value corresponding to the minimum production in these wells and the maximum at the value of EUR obtained for the well at the tenth percentile.
| Oil AU (MMbo) | Min | Med | Max |
|---|
| Sweet Spot | 0.022 | 0.199 | 0.628 |
| Non Sweet Spot | 0.002 | 0.022 | 0.049 |
Table 9-1. Parameters for estimated ultimate recovery used in resource assessment of Oil Assessment Unit.
(ed., Sweet Spot Max updated to "0.628"; original was "0.022". 7/15/2015)
| Wet Gas AU (Bcf) | Min | Med | Max |
|---|
| Sweet Spot | 0.64 | 5.76 | 18.84 |
| Non Sweet Spot | 0.20 | 0.64 | 1.19 |
Table 9-2. Parameters for estimated ultimate recovery used in resource assessment of Wet Gas Assessment Unit.
| Gas AU (Bcf) | Min | Med | Max |
|---|
| Sweet Spot | 0.19 | 7.09 | 30.37 |
| Non Sweet Spot | 0.039 | 0.19 | 0.32 |
Table 9-3. Parameters for estimated ultimate recovery used in resource assessment of Gas Assessment Unit.
9.1.3 Success Ratios and Co-Product Ratios
Success ratios were defined, where possible, by examination of well performance (wells with zero production over several years, plugged wells, areas of numerous cancelled permits). Success ratios in sweet spots were set at the same values across assessment units: minimum of 90%, mode of 95% and maximum of 99%. They were set very low outside the sweet spot for the Oil Assessment Unit: minimum of 1%, mode of 5% and maximum of 10%, whereas these parameters for the Gas and the Wet Gas Assessment Units were set at 5, 10 and 40% respectively.
Co-product ratios were calculated from public records and used only for the oil assessment unit. The largest source of production data was the public database from the state of Ohio. In Ohio’s way of recordkeeping, production data report NGLs and gas as a single number. Therefore, calculation of the gas resource in both the gas and wet gas assessment units includes a significant percentage of natural gas liquids which could not be separated from these totals and/or evaluated individually. For this reason, we did not include NGLs in the liquids-to-gas ratio for the gas AU or a NGLs-to-gas ratio for the oil AU. Parameters used for the gas-to-oil ratio distribution in the Oil Assessment Unit were 900 scfg/bo minimum, 3600 scfg/bo mode and 8000 scfg/bo maximum.
9.1.4 Results
The results of the probabilistic resource assessment are provided in Table 9-4. Because total oil and gas resources tend to follow a logarithmic distribution, means assessment values are higher than the medians. Total mean gas resource, which includes wet gas equivalent in the Wet Gas and Oil assessments units, sums to 782,171 Bcf. Total oil resource is 1960 MMbo.
Oil Assessment
Unit | Oil (MMbo) | Gas (Bcf) |
|---|
| F95 | F50 | F5 | Mean | F9 | F50 | F5 | Mean |
|---|
| Sweet Spot | 733 | 1677 | 3744 | 1908 | 2231 | 6636 | 17,722 | 7949 |
| NonSweet Spot | 23 | 49 | 91 | 52 | 69 | 191 | 446 | 216 |
| Total | 791 | 1728 | 3788 | 1960 | 2370 | 6858 | 17,960 | 8165 |
Wet Gas
Assessment Unit | Oil (MMbo) | Gas (Bcf) |
|---|
| F95 | F50 | F5 | Mean | F95 | F50 | F5 | Mean |
|---|
| Sweet Spot | | | | | 23,840 | 49,601 | 106,550 | 55,980 |
| NonSweet Spot | | | | | 99 | 379 | 1023 | 447 |
| Total | | | | | 24,484 | 50,037 | 106,852 | 56,427 |
Gas Assessment
Unit | Oil (MMbo) | Gas (Bcf) |
|---|
| F95 | F50 | F5 | Mean | F95 | F50 | F5 | Mean |
|---|
| Sweet Spot | | | | | 220,473 | 590,680 | 1,542,873 | 710,341 |
| NonSweet Spot | | | | | 2862 | 6584 | 13,835 | 7238 |
| Total | | | | | 228,478 | 598,026 | 1,549,586 | 717,579 |
Table 9-4: Summary of recoverable oil and gas remaining.
MMbo = million barrels of oil
Bcf = billion cubic feet of gas