6.1 Bulk Mineralogy
The Consortium website provides access to bulk mineralogy results for more than 1200 samples collected at dozens of well locations throughout the Study area.
A majority of these (i.e., 930) were specifically analyzed for the current Study Appendix 6-A  (PDF, 14.9 MB; 27 pages).
The remaining bulk mineralogy data (i.e., 299 samples taken from 78 cores) represent legacy XRD analyses from Ohio, and are not discussed herein.
6.1.1 X-ray Diffraction
6.1.1.1 Materials and Methods
PAGS was the team lead on bulk mineralogy testing performed for the Study. Accordingly, PAGS purchased and installed new XRD equipment for this project in June 2013. The equipment includes a computed tomography (CT) stage (Figure 6-1A) and a multi-sample changer (Figure 6-1B). The multi-sample changer was heavily used by John Barnes, the PAGS geochemist who performed the XRD work between July 2013 and April 2014.
PAGS obtained outcrop samples of Utica-equivalent rocks from 18 outcrops in central Pennsylvania during the field season of 2012. In addition, we collected drill cutting samples from both survey repositories and newer well locations donated by Consortium partners for 28 wells in the Study area, including five wells in New York, six wells in Ohio and 17 wells in Pennsylvania. The locations of the outcrops and wells are shown in Figure 6-2 and additional details are given in Table 6-1.
The mineral compositions of 930 samples representing all 18 outcrops and 28 drill holes were determined using X-ray powder diffraction. The analyses were run using a PANalytical Empyrean X-ray diffractometer. The samples were loaded in 16-mm-diameter back-packed sample holders that were mounted in a sample spinner. The results were interpreted using PANalytical HighScore Plus software and the ICDD PDF-4 database. Replicate analyses of 55 samples, representing both outcrops and drill holes, were run as a test of precision.
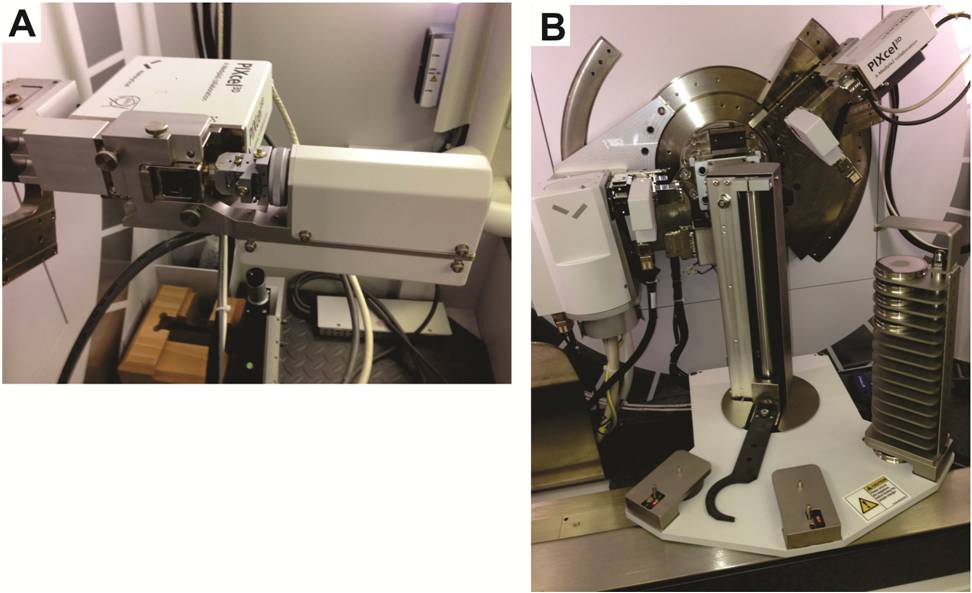
Figure 6-1. Photographs of the XRD equipment at the PAGS laboratory in Middletown, PA.
A - CT stage used to measure sample density.
B - XRD equipped with multi-sample changer.
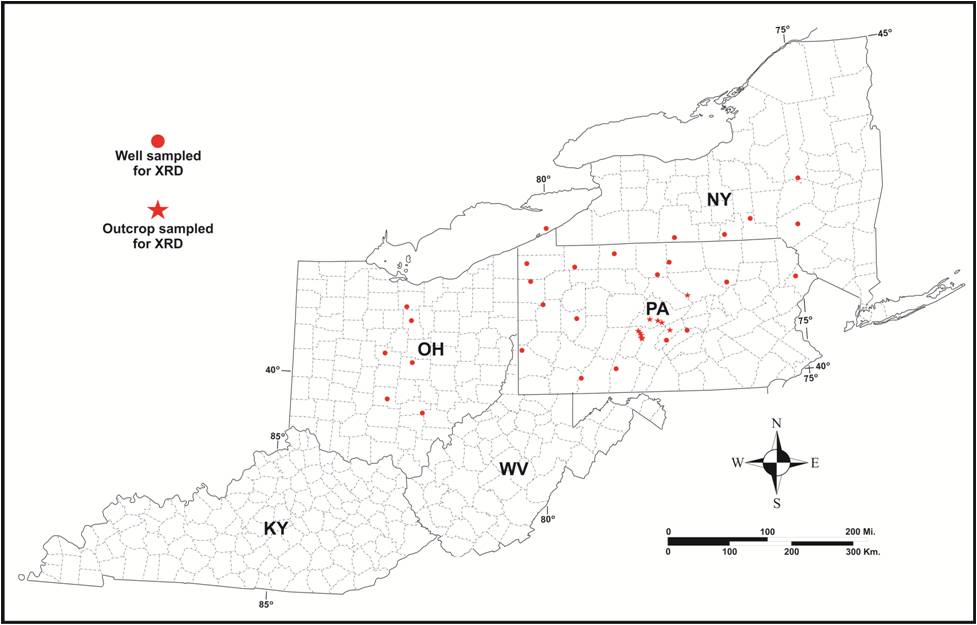
Figure 6-2. Location map of outcrops and wells sampled for XRD analysis as part of the Study. See Table 6-1 for details.
Two different methods of calculating semi-quantitative results were attempted before it was determined that one was clearly superior to the other for this set of samples.
The initial attempt to obtain semi-quantitative results used the Reference Intensity Ratio (RIR) method.
According to this method, quantities of minerals in a mixture are determined by comparing the intensities of each mineral’s most intense diffraction peaks to each other and to the published ratios of their most intense peaks to the most intense peak of the stable mineral corundum (Al2O3).
This method can sometimes work for minerals that have relatively consistent simple chemical compositions and molecular structures, such as quartz and calcite.
The replicate analyses for this Study, however, clearly showed that it yielded unsatisfactory results because the method is strongly affected by which polytypes of layered silicate minerals (e.g., muscovite) are present.
Knowing exactly which polytype of such a mineral is present is very difficult to determine in a timely way for scans of mixtures of minerals, especially in a project that involves hundreds of samples.
Even as this comparative analysis of XRD interpretive methods was being performed, PAGS prepared 24 grain mount thin sections for petrographic analysis in an effort to:
(1) better estimate bulk clay mineralogy composition in selected Utica and equivalent samples from Pennsylvania, and
(2) investigate whether the RIR method was on the right track in interpreting clay mineralogy percentages.
Comparison of the petrographic analyses derived from this sample set with their corresponding XRD mineralogy results indicated that there is no direct correspondence between these approaches.
The thin section photomicrographs and data derived from this particular effort are included in Appendix 6-B  (PDF, 1.25 MB; 8 pages).
A second attempt to obtain semi-quantitative results was made using the Rietveld method, a more sophisticated method that uses the whole X-ray pattern, not just its most intense peaks, to find agreement between observed patterns and the published crystal structure data of the minerals through least-squares analyses.
Quantities are then calculated based on these analyses. This method can take into account such factors as preferred orientation and peak shape that can present problems in dealing with layered silicate minerals.
The HighScore Plus software enabled the programming of an automated Rietveld procedure that took these factors into account, and that was able to provide a level of precision sufficient for dividing the minerals into the major categories reported herein for classifying the lithologies that were encountered.
| API No. | State | County | Location/Well Name | Sample Depths (ft) | Number
of
Samples |
|---|
| NA | PA | Various | Outcrops in central PA | NA | 18 |
| 3100705087 | NY | Broome | Richards No. 1 | 7400-7940 | 25 |
| 3102504214 | NY | Delaware | Campbell No. 1 | 7400-8300 | 19 |
| 3104303993 | NY | Herkimer | Skranko No. 1 | 1550-2950 | 26 |
| 3110103924 | NY | Steuben | Olin No. 1 | 9500-10,010 | 20 |
| 3110723883 | NY | Tioga | Beach No. 1 | 10,000-10,700 | 35 |
| 3404120253 | OH | Delaware | Weed No. 1 | 1650-1960 | 29 |
| 3407323283 | OH | Hocking | Sunday Creek Coal Co. No. 3-S | 4450-4790 | 33 |
| 3407720028 | OH | Huron | Newmeyer No. 1 | 2568-2935 | 32 |
| 3408926065 | OH | Licking | Rowe-Grube Unit No. 1-3613 | 3300-3570 | 27 |
| 3412920089 | OH | Pickaway | Clutts George & Sue No. 1 | 1590-1960 | 37 |
| 3413920608 | OH | Richland | Joseph Kruso No. 1 | 3210-3520 | 29 |
| 3700521201 | PA | Armstrong | Martin No. 1 | 11,750-12,020 | 30 |
| 3700920034 | PA | Bedford | Schellsburg Unit No. 1 | 7300-7700 | 40 |
| 3701990063 | PA | Butler | Hockenberry No. 1 | 8404-8902 | 46 |
| 3702720001 | PA | Centre | Long No. 1 | 13,800-14,250 | 2 |
| 3703520276 | PA | Clinton | Commonwealth of PA Tr. 285 No. 1 | 14,000-14,500 | 49 |
| 3703920007 | PA | Crawford | Kardosh No. 1 | 5870-6280 | 44 |
| 3704920049 | PA | Erie | PA Dept. of Forests & Waters Block 2 No. 1 | 3705-4096 | 37 |
| 3706720001 | PA | Juniata | Shade Mt. No. 1 | 3650-3900 | 25 |
| 3708333511 | PA | McKean | Say No. 1 | 9000-9200 | 20 |
| 3708520116 | PA | Mercer | Fleck No. 1 | 6650-7200 | 57 |
| 3708720002 | PA | Mifflin | Commonwealth of PA Tr. 377 No. 1 | 5050-5350 | 20 |
| 3710320003 | PA | Pike | Commonwealth of PA Tr. 163 No. C-1 | 13,400-13,600 | 18 |
| 3711120045 | PA | Somerset | Svetz No. 1 | 15,000-15,170 | 16 |
| 3711320002 | PA | Sullivan | Dieffenbach No. 2951 | 16,050-16,450 | 3 |
| 3711720181 | PA | Tioga | Marshlands No. 2 | 11,660-12,130 | 46 |
| 3712320150 | PA | Warren | Shaw No. 1 | 8047-8376 | 48 |
| 3712522278 | PA | Washington | Starvaggi No. 1 | 10,030-11,010 | 99 |
| Total Samples | 930 |
Table 6-1. Location of samples that have undergone XRD analysis.
6.1.1.2 Results
As XRD analyses were interpreted, data were assigned to three categories – quartz plus feldspar, carbonate and clay minerals.
PAGS plotted the data for these three categories for all of the wells in which more than three intervals were sampled.
The plots reflect changes in mineralogy with depth. Displaying the mineralogy results in this manner facilitates the interpretation (or in many cases, confirmation of past interpretation)
of Utica and other formation tops (e.g., Figure 6-3).
It should be pointed out, however, that the XRD plots are based on drill cuttings obtained from intervals within each well, and interpretations based on them without reference to geophysical
logs of the same intervals may result in inconsistent or inaccurate correlations.
A complete set of these data plots, as well as of the data spreadsheets used to develop them, is provided in Appendix 6-A  (PDF, 14.9 MB; 27 pages).

Figure 6-3. Mineral fraction (weight %) versus sample depth (ft) for selected samples in, from left to right, Ohio, Pennsylvania and New York, and their possible use in stratigraphic correlation.
Deflections in clay and carbonate mineral percentages may be used to mark the boundaries between the Utica Shale and Point Pleasant Formation (where they both exist),
as well as clearly identify the underlying Trenton/Lexington Formation.
A small deflection in the clay and carbonate fractions within the Lexington/Trenton Formation possibly identifies the Logana Member and equivalent Flat Creek Shale of New York.
6.1.2 SEM – Energy-Dispersive Spectroscopy
6.1.2.1 Methods
PAGS used SEM imaging in conjunction with energy-dispersive spectroscopy (EDS) techniques to further evaluate the bulk mineralogy composition of nine rock cuttings samples from three wells in Pennsylvania.
The samples were chosen for size (>3 mm in largest diameter) from intervals of these wells determined to contain Utica or Point Pleasant shale.
The SEM images and corresponding SEM-EDS analytical data (including graphs, text files and element maps) are included in Appendix 6-C  (PDF, 17.0 MB; 28 pages).
6.1.2.2 Results
Analytical data for each sample are provided in three parts:
(1) a high-resolution image with a nine-digit file name (e.g., S13-013-001) (see, for example, Figure 6-4);
(2) an EDS spectrum, which includes a graph and a text file in which the percentages of the elements are listed (Figures 6-5A and B).
The percentages represent the entire area shown in the high-resolution image; and
(3) a set of element maps showing the image in subdued form overlain with colored dots that show where the element was detected (Figure 6-6).
The maps assist with detecting the distribution of minerals.
For example, the map for sulfur (Figure 6-6A) shows where pyrite grains exist, whereas the map for calcium (Figure 6-6B) probably indicates the distribution of carbonates (but could also represent plagioclase feldspars).
For each sample, there are separate maps for the elements that were detected, including aluminum, calcium, iron, potassium, magnesium, sodium, sulfur, silicon and titanium.
Oxygen, although present, was not included because it occurs in nearly every mineral in these samples; a plot of oxygen would be meaningless under the circumstances.
Another element that is conspicuously absent is carbon.
Carbon is difficult to detect with the instrument used unless it is extremely abundant.
In addition, there is a peak for calcium that coincides with the main peak for carbon, making detecting carbon in calcite nearly impossible, even though we know it is there.
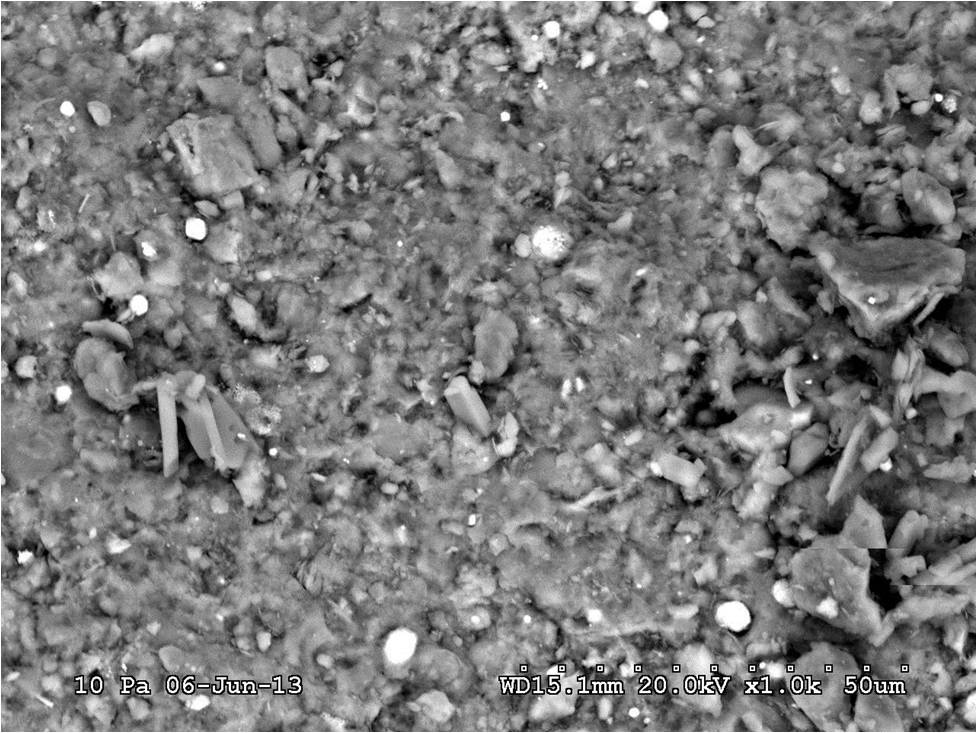
Figure 6-4. High-resolution SEM image of specimen S13-013-001 from sample interval 8504-8513 ft in the Hockenberry No. 1, Butler County, PA.
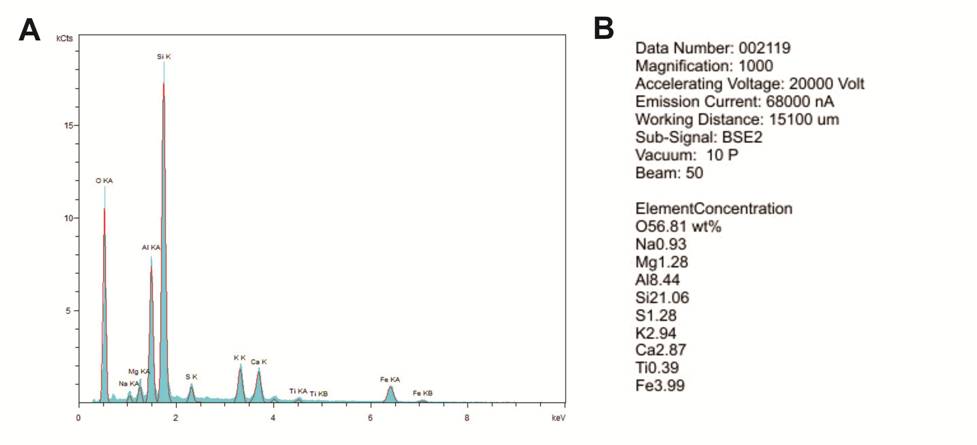
Figure 6-5. Energy-dispersive spectroscopy (EDS) analysis of the sample in Figure 6-4.
A – Graph of the elements detected.
B – Text file generated to describe the elemental concentrations (weight %) of the primary elements detected in Figure 6-4.
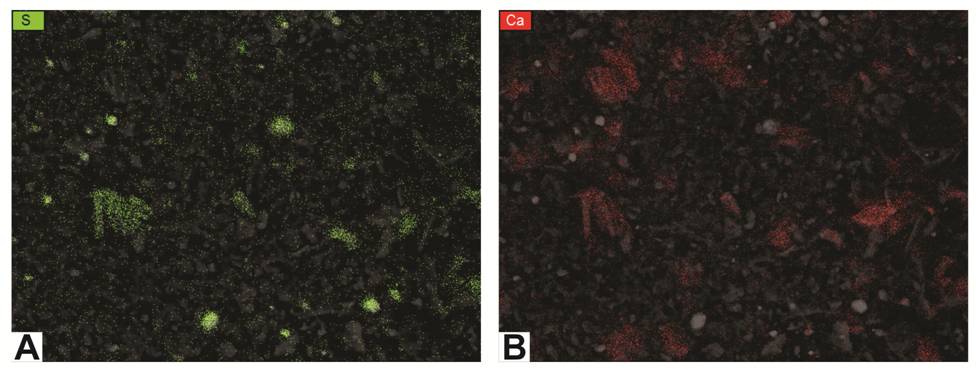
Figure 6-6. Element maps for the image in Figure 6-4 using EDS.
A – map of sulfur (green dots); clusters most likely indicate pyrite.
B – map of calcium (red dots); clusters most likely indicate calcite or dolomite.
It should be noted that, because these rock fragments do not have perfectly smooth, polished surfaces (i.e., ion milling was not used to process these particular samples),
there are places where no element is plotted on the map. Those are areas that were hidden from the detector because of the sample’s rough surface.
Further, while most of the elements can easily be correlated with specific grains that are visible in the images, some elements show up only as random dots that are sparsely but evenly scattered across a given sample.
This likely represents instrument noise and is not a true representation of the present of an element.
This is especially noticeable for magnesium and potassium maps in some of these samples.
PAGS also prepared element maps that illustrate multiple elements in contrasting colors (Figure 6-7).
These can be used not only to show the distribution of elements, but also to verify the identity of grains in the SEM photomicrographs.
For example, Figures 6-7A and 6-7B provide maps of silicon and calcium in two wells located at opposite ends of Pennsylvania (Butler and Pike counties).
It appears that both samples include grains that are high in calcium and basically devoid of silicon, so these grains should be carbonates rather than plagioclase feldspars.
The maps also indicate different calcium contents in these samples, which agrees with the XRD analyses from these wells (total carbonate content in the sampled interval of the Butler County well is 6%, whereas total carbonate content in the sampled interval of the Pike County well is 45%).
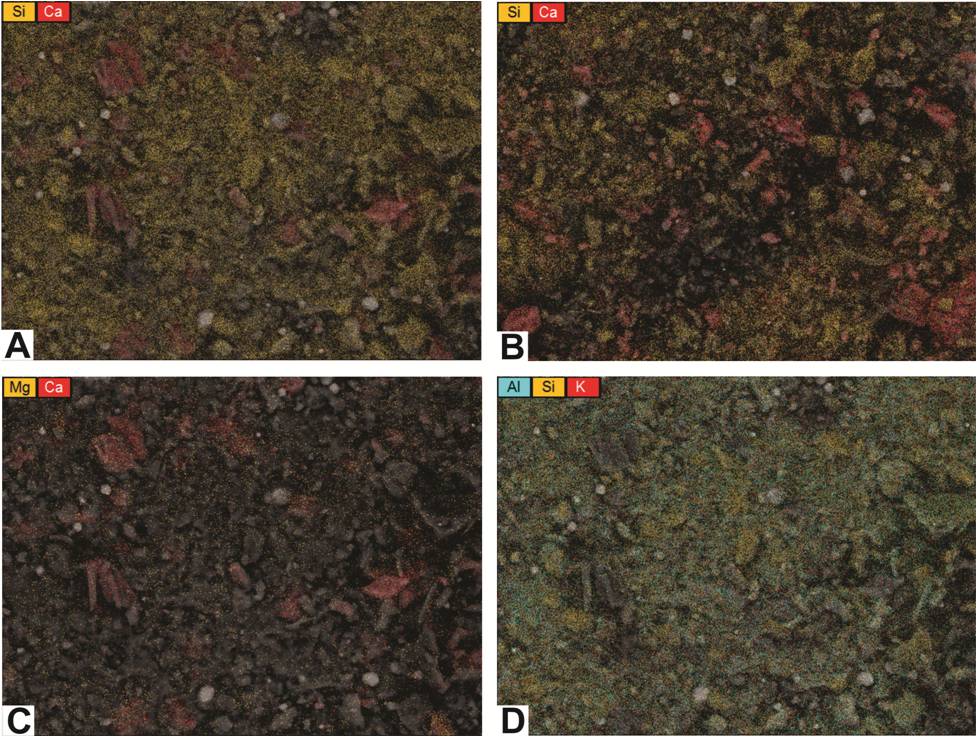
Figure 6-7. Element maps showing distributions of multiple elements.
A, C, and D – maps of a rock cuttings sample from a depth of 8504-8513 ft in the Hockenberry No. 1, Butler County, PA.
B – map of a rock cuttings sample from a depth of 13,440-13,450 ft in the PA Tract 163 No. 1, Pike County, PA (shown for contrast with A).
Other element maps can be used to detect different minerals. Figure 6-7C is a map of magnesium and calcium in the same Butler County sample as shown in Figure 6-7A.
There is very little magnesium in this sample, so the carbonate grains are most likely calcite rather than dolomite.
Figure 6-7D is a three-color map of aluminum, silicon and potassium of this same sample.
It shows an abundance of each element scattered across the map, suggesting that the majority of this sample is a potassium aluminum silicate.
Although the distribution of these elements could indicate clay minerals, k-feldspar, and/or other silicate minerals, the XRD analysis associated with this sample found no k-feldspar present.
Therefore, the XRD results are consistent with the interpretation that the matrix in this particular Butler County sample is most likely comprised of one or more clay minerals (e.g., illite).