8.2 CT X-ray Analysis
Rock cores from two different regions of the Study area were made available for examination and analysis by X-ray Computed Axial Tomography (CT X-ray).
WVGES provided access to three surficial rock cores, collected as geotechnical samples from the Lost River dam site in the eastern panhandle of West Virginia (Hardy County) (Figure 8-6).
These cores, cut in 1977, are 2.5-in round (unslabbed) and comprise the Martinsburg Formation, a shale and limestone that are partially equivalent to the Kope Formation and Utica Shale
(see Figure 2-1). In addition, ODGS provided core from the Fred Barth No. 3 (API#3403122838), drilled in Coshocton County, Ohio, in 1976. This core comprises the more typical open marine,
organic-rich, calcareous black shale associated with the Point Pleasant Formation (Figure 8-6). As one of the few publicly available Utica/Point Pleasant cores in Ohio,
the Barth also has been heavily sampled, plugged and cut.
The Lost River cores were used to demonstrate proof-of-concept for the CT X-ray analyses performed by U.S. DOE NETL. As part of this work, the lithology and core features were described by DOE
geoscience interns following protocols developed by the predecessor of the U.S. DOE for the Eastern Gas Shales Project (EGSP) in the late 1970s. The cores were then
scanned through a Multi Sensor Core Logger (MSCL) for magnetic susceptibility, p-wave velocity, natural GR, and elemental composition by X-ray Fluorescence (XRF).
Selected intervals were then analyzed by CT X-ray analysis. Following this proof-of-concept effort, the Fred Barth No. 3 core was also evaluated.
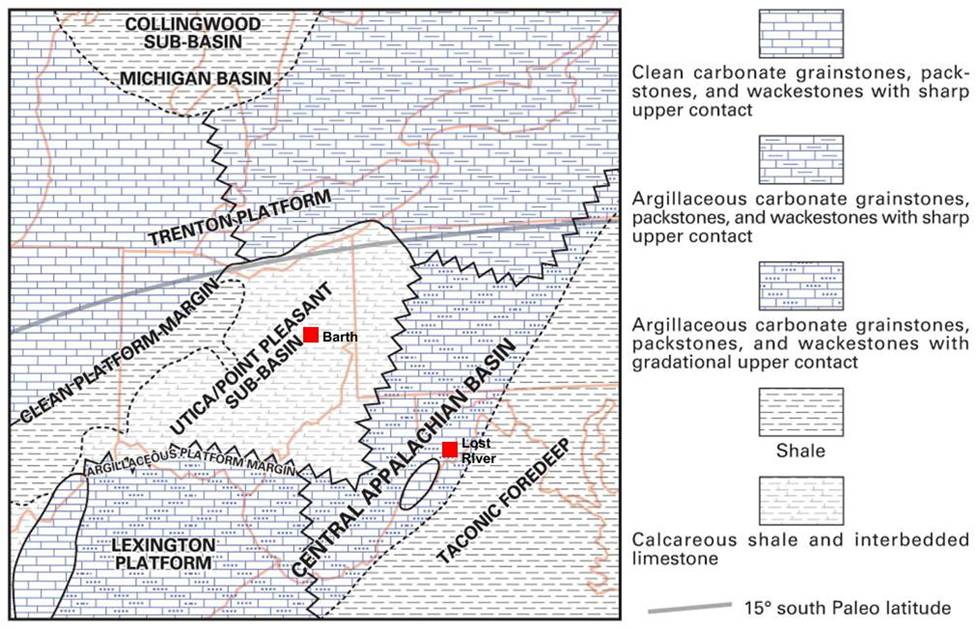
Figure 8-6. Map of the Study area showing generalized locations of the Barth and Lost River cores, superimposed on a facies map of Trenton/Point Pleasant time from the Trenton-Black River study (modified after Wickstrom and others, 2012).
8.2.1 Overview
X-ray Computed Axial Tomography, commonly known as a CT scan or “CAT” scan, produces images by measuring the contrast in transmission as X-rays pass through areas of different density within a sample. The “computed” part of the process is a software-based, three-dimensional digital reconstruction of the scanned object from numerous two-dimensional radiographs collected at multiple angles around an object (Rodriguez and others, 2014).
The first application of this technology in the 1970s was for medical use to non-invasively visualize the inside of the human body. The petroleum industry quickly recognized the applications of CT scanning for characterizing the internal structure of rock cores, and readily adopted it, along with the similar technology of Magnetic Resonance Imaging (MRI).
The configuration of the machines can vary widely, but in general, a CT scanner will have an X-ray source located opposite an X-ray detector. The sample to be imaged is placed between the two, and axial images are generated by rotating either the X-ray components or the sample, typically through a full 360° rotation.
The density, thickness and material composition of the sample determine what percentage of X-rays pass through to the detector. The linear attenuation coefficient μ at each point in the two-dimensional radiograph is measured by the CT detector. The μ is defined by Beer’s law (Karacan, 2003),
where I
o is the incident X-ray intensity and I is the intensity remaining after the X-ray passes through a thickness, h, of the sample.
At X-ray energy levels below 200 kilovolts (kV), attenuation of X-rays is known to be primarily dependent on photoelectric adsorption,
which is a function of the material density and the atomic number of the material, and Compton scattering, which is a function of electron density (Karacan, 2003).
In general, however, high-density, thick and higher atomic number materials block a greater portion of the X-rays than lower-density, thinner or lower
atomic number materials (Rodriguez, and others, 2014).
The spatial variation in μ is detected at each angle and results in a single two-dimensional radiograph of the sample. Data from radiographs are reconstructed using machine- and manufacturer-specific algorithms
into a three-dimensional volume where each volume-pixel (voxel) of data is represented by a 16-bit grayscale value. Voxel dimensions are a function of the scan geometry, i.e., the distance between the X-ray source,
the detector, and the object being scanned. The grayscale values are a function of the μ value, referred to as the CT Number (CTN). CTN values are often displayed with a grayscale color coding scheme such that low CTN
are dark and high CTN are bright. Generally speaking, low-density materials are dark, and high-density materials are bright. It is important to keep this in mind if X-ray images are compared with SEM photomicrographs or
other images. The X-ray is essentially a "negative" image, with dense materials such as pyrite appearing white, and low density areas such as fractures appearing black.
Post-processing of the CTN values can result in a wide range of color schemes applied to reconstructed CT scans. An example of a reconstruction is shown in Figure 8-7.
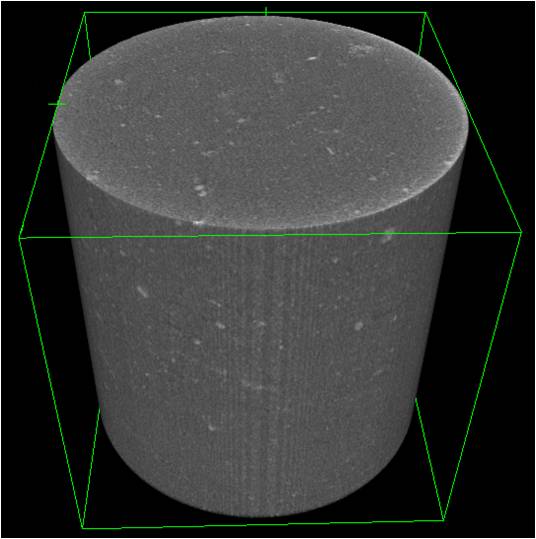
Figure 8-7. A 3-D image reconstruction of a Marcellus Shale core from the NETL CT scanner (Rodriguez and others, 2014).
8.2.2 Instrument Resolution
CT scanners have different image resolutions depending on their design. When applying these instruments to fine-grained rocks such as shale, it is important to recognize the limitations of the technology. In general, the maximum image resolution of a particular instrument and the maximum sample size are inversely proportional. For example, a scanner that can show features as small as a few microns will typically only be able to handle a sample the size of a pencil eraser. Scanners that can visualize an entire human body may only be able to show features as fine as a few mm. CT scanners in use at NETL include three types – medical, industrial and ultra-high resolution (micro- and/or nano-CT) – and are described in turn below.
Medical scanners are designed so that the X-ray source and detector rotate around the subject, such as a human body. Many modern medical CT scanners use fan beams of X-rays and multiple banks of detectors to capture multiple radiograph slices quickly, thus reducing the time of the scan and the amount of radiation to which a patient may be subjected. The “medical” scanner in use at NETL actually employs a higher-power X-ray source compared to standard units found in hospitals. This achieves greater penetration of rock samples, some of which are confined in pressure vessels or have fluid moving through the pore space. That said, it is not safe for scanning human body parts.
The NETL medical scanner, similar to the unit shown in Figure 8-8, was used for whole-core analysis of the Lost River and Barth cores. The geometry of the scanner and the rapid scanning process produced images with a resolution of a few tenths of a millimeter. Despite the relatively low resolution, it was ideal for scanning bulk core samples and identifying features for study on the higher resolution CT scanning units available at NETL. An example of a medical
CT scan on a 3-ft segment of Martinsburg Formation from the Lost River core is shown as a two-dimensional image in Figure 8-9.
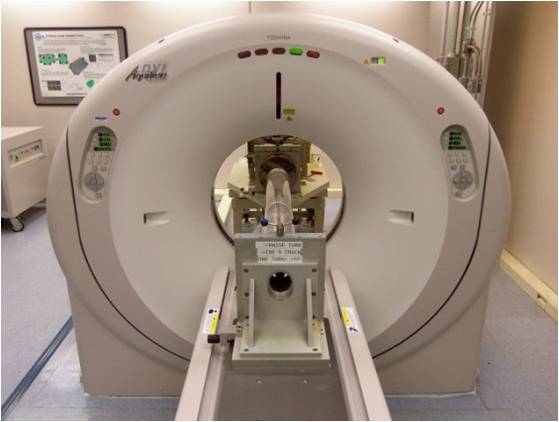
Figure 8-8. A 16-slice Aquillion medical CT scanner, similar to the unit in use at NETL.

Figure 8-9. CT scan of a 2-D slice through the center of a 3-ft long segment of the Martinsburg Formation from the Lost River core. Darker (less dense) bands generally correlate with regions
of higher organic matter content; lighter zones represent denser carbonate.
Fine, dark traces delineate fractures.
The industrial CT scanner was designed primarily for quality control of manufactured parts. Larger systems, for quality control on fully assembled vehicles for instance, have fully independent articulating
arms that enable the CT source and detector to move around the sample. Within the geosciences, smaller systems are typically used that employ a rotating sample stage with a fixed X-ray source and detector
placed on either side of the subject. The NETL unit uses a stage that rotates about a vertical axis, and the distance between the source and detector can be adjusted. The ability to scan geologic samples
using high powered X-rays results in higher resolution scans than medical CT scanners can provide. This is especially effective if the X-ray source is brought in close to the object, and the detector is relatively far away.
However, the scans typically take much longer than medical units, sometimes requiring overnight to build up an image.
Two photographs of the NorthStar Imaging M-5000 industrial CT scanner at NETL are shown in Figure 8-10, with the detector on the left and the X-ray source on the right. In both images, the same four-inch diameter sandstone
core is shown on the rotating sample stage. An example of the scan quality from this type of scanner is provided in Figure 8-11.
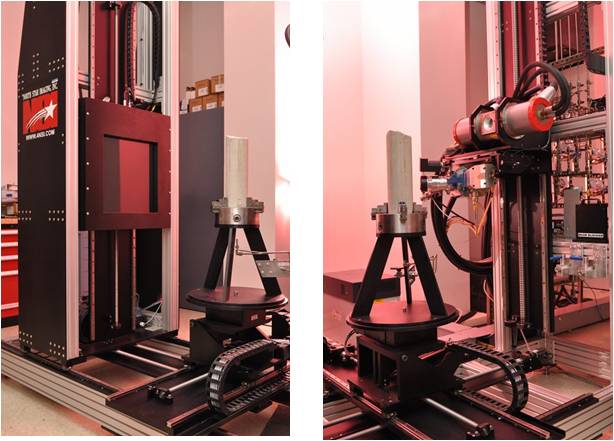
Figure 8-10. NorthStar Imaging M-5000 industrial CT scanner at NETL. Left: X-ray detector with vertical sandstone core. Right: X-ray source with vertical sandstone core.
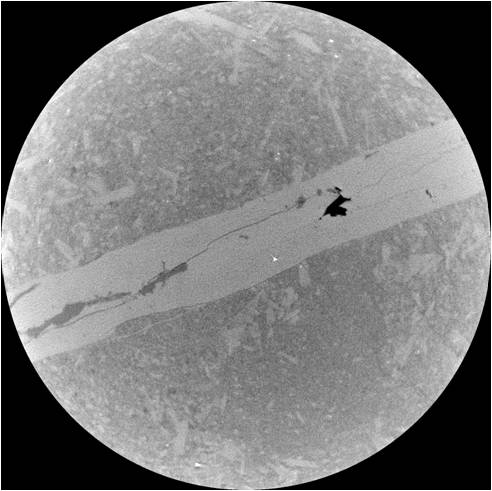
Figure 8-11. Scanned image of single layer of data along an XY plane through a one-in diameter sample of Marcellus Shale containing a mineralized fracture. Data obtained from the NETL industrial scanner.
Ultra-high resolution micro-CT and nano-CT scanners are high-precision instruments that enable samples to be scanned extremely close to the X-ray source for unprecedented detail in the resulting images.
These systems are generally constructed inside of enclosures to enable their use in laboratories without the need for additional radiation shielding. The micro-CT at NETL utilizes samples a few mm in diameter
(roughly the diameter of a pencil). Nano-CT scanners, available at several of the universities associated with NETL, use samples that are approximately the size of a sand grain.
Scanning takes many hours, and for the largest samples capable of being analyzed, the scanning effort may literally require days. Tiny samples coupled with high-resolution scanning can result in reconstructed
images with a voxel volume of less than 1 cubic μm.
Attempting to translate these small volumes back to the scale of a geologic reservoir can be challenging.
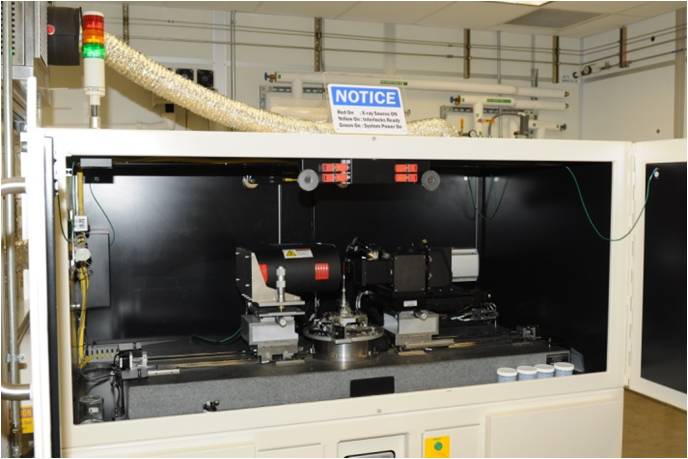
Figure 8-12. The micro-CT scanner at NETL. Source is on the left, rotating stage is the pedestal in the center, and detector is on the right.
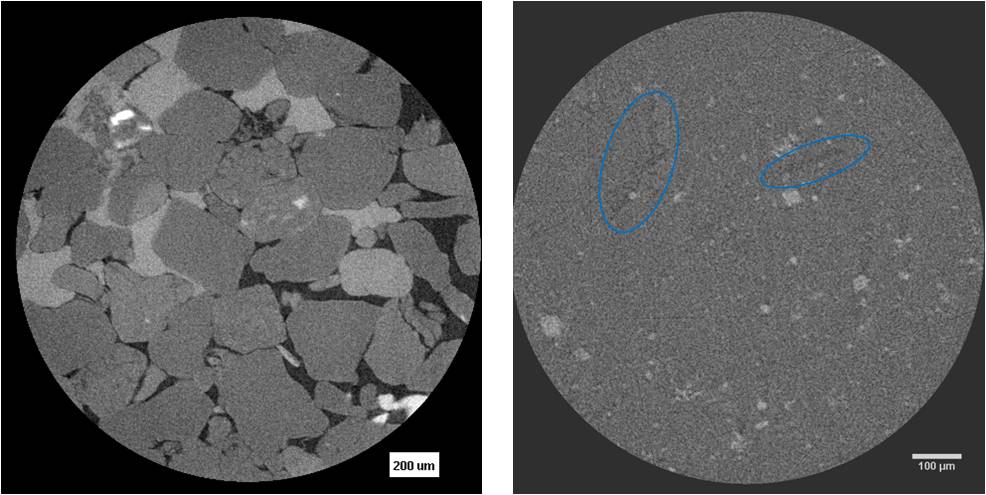
Figure 8-13. Micro-CT images of core samples. Left: 6-mm diameter sample of calcite-cemented sandstone. Right: 4-mm diameter sample of Marcellus Shale. The blue ellipses outline organic matter.
8.2.3 Results
8.2.3.1 Lost River Core
Proof-of-concept analysis of the Lost River cores began with macroscopic characterization and petrophysical logging followed by X-ray CT analysis. Core lithology logging techniques developed by the U.S. DOE and Cliffs Minerals for the EGSP were adapted for use on these samples.
Descriptions included rock type, color, bedding, fractures, and notable geologic features (Figure 8-14).
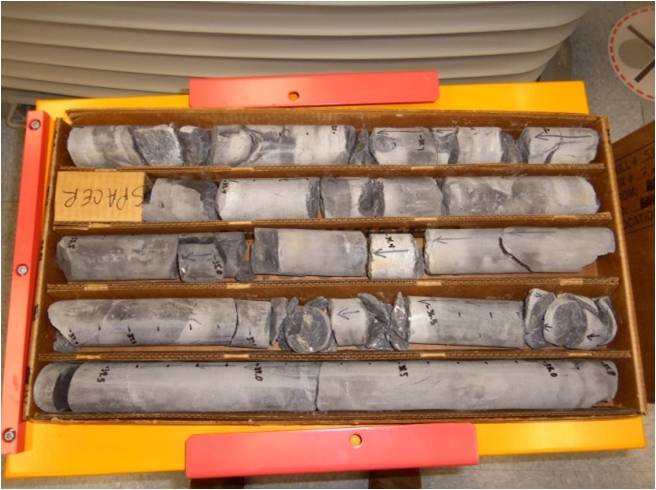
Figure 8-14. Photograph of a box of Lost River core. Note color variations (light gray to gray) that suggest relatively high carbonate and low organic content in this sampling of the Martinsburg Formation. (Image: U.S. DOE).
Core measurements were made using a Geotek© MSCL on intact segments of Lost River core samples (Figure 8-15). Measured parameters included magnetic susceptibility, acoustic impendence via P-wave velocity measurements,
gamma density using a Cesium-137 source, and elemental composition via XRF spectrometry (Figure 8-16).
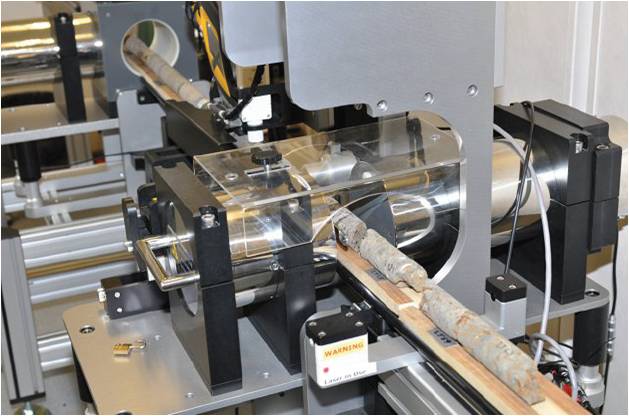
Figure 8-15. The GeoTek Multi-Sensor Core Logger (MSCL) scanning Lost River core at NETL. Photograph by Karl Jarvis.
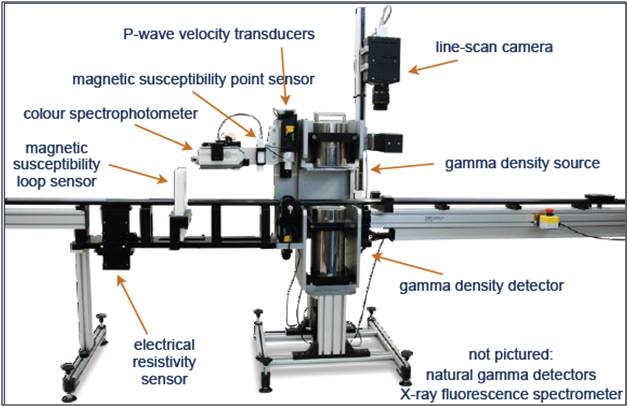
Figure 8-16. Components of the Geotek MSCL (Geotek Ltd., Geotek Multi-Sensor Core Logger Flyer. Daventry, UK, 2009)
The Lost River core data were assembled into spreadsheets for side-by-side comparison using a software program called Strater™. This software allows multiple data streams to be combined into one
easy-to-read log for each core. It uses a standard input file format that includes the proper headers, empty lines for missing data sections, and different tabs for different data sets.
Core analytical results and data files were imported into a Strater™ template (Figure 8-17), and compiled to create the log files included in Appendix 8-C.
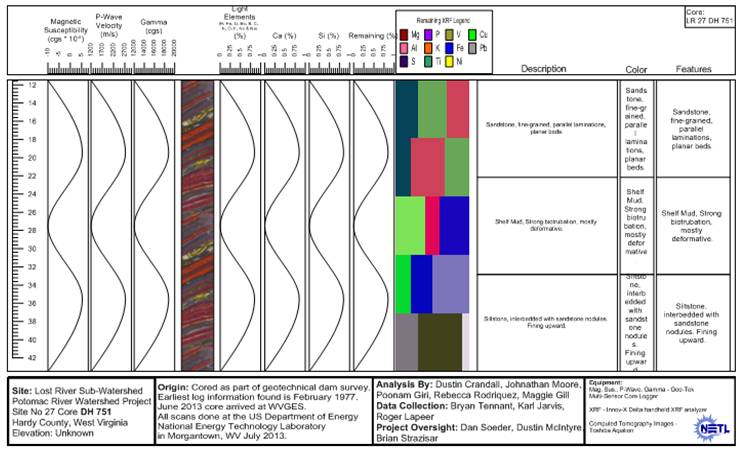
Figure 8-17. An example of the template from the Strater™ software used to display core data.
Once the macroscopic and petrophysical testing of these core samples was complete, the Lost River samples were subjected to X-ray CT analysis.
Three-dimensional reconstructions from X-ray CT imaging can be evaluated quantitatively to determine surface areas, pore volume/porosity, mineral volumes, pore size distribution,
relative permeability, or variations in any of these properties. Such calculations are often performed with the aid of image analysis software (such as the open-source program ImageJ or Avizo Fire).
Since the pixel values in these images represent relative density or composition, thresholding (i.e., selecting specific pixel values), along with cluster analysis, can isolate a desired volume from the rest of the rock volume.
This can then be used to determine bulk composition, porosity, or changes in either. A 3-D reconstruction of an industrial X-ray CT scan of the Martinsburg Formation from the Lost River core is provided in Figure 8-18,
where minerals and voids have been isolated.
More extensive analysis can yield connected porosity, disconnected porosity, pore size distribution, permeability and relative permeability.
The Martinsburg Formation, a generally fine-grained, micritic limestone with shell beds and interbedded, organic-rich argillaceous units, was characterized in detail using the lithologic description procedures,
MSCL, and CT-scanning technologies available at NETL.
The methodology has applications across the Utica and in other shale formations.
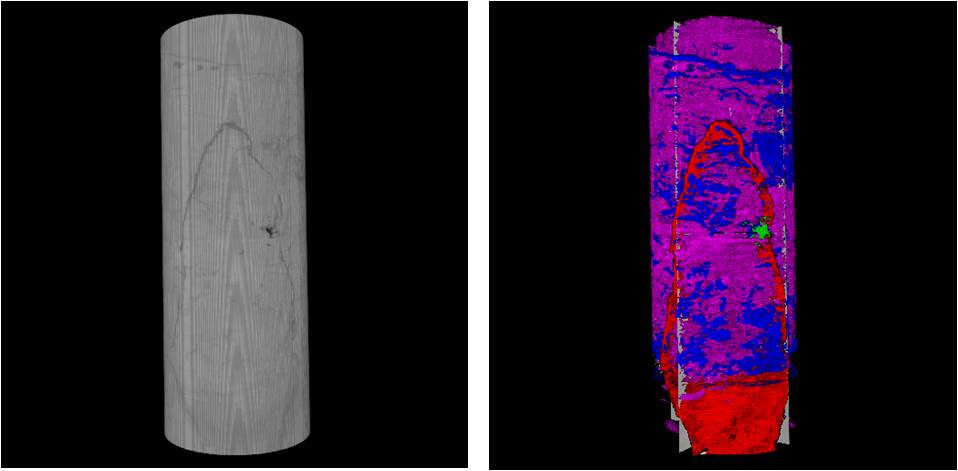
Figure 8-18. Images of Martinsburg Formation core scanned in industrial X-ray CT. Left: 3D view of original reconstruction.
Right: Core segmented by density and clustering.
Red: fracture volume. Blue: organic matter. Pink: carbonate. Green: porosity. (Image: U.S. DOE).
8.2.3.2 Fred Barth No. 3
Five sections of relatively intact Fred Barth No. 3 core samples were scanned with the NETL industrial CT-Scanner, and data for each sample are in the form of a .tiff stack. The images were delineated via best-edge approximation and un-tilting of the core sample. An example of the horizontal slices imaged through a core is provided below as a montage (Figure 8-19). X & Y planar slices lengthwise down the core also were created for each data set to represent the true variability in the core samples. One of these lengthwise images is shown next to the montage. All of the Fred Barth No. 3 scans are included in Appendix 8-D.
The MSCL was not employed on the Fred Barth No. 3 core because of the extensive plugging, slabbing and sample removal from the Point Pleasant interval (see Figure 8-20 below). The MSCL requires whole core samples to produce accurate data, and these were simply not available in this core. Lithologic descriptions had already been prepared for this core, as had porosity and permeability measurements, RockEval, porosimetry, petrography and a host of other analyses as described below. It seemed redundant to repeat these measurements, especially on core that had been so thoroughly cut, plugged and aged.
The CT scans indicate that the Barth core, while still calcareous, is much more argillaceous and clastic in origin than the Martinsburg Formation from the Lost River core. The organic matter content is considerably higher, and the core contains fewer natural fractures than the Lost River samples. The Utica/Point Pleasant Formation in the Fred Barth No. 3 core displays many of the characteristics that producers seek when developing this shale for natural gas and NGLs.
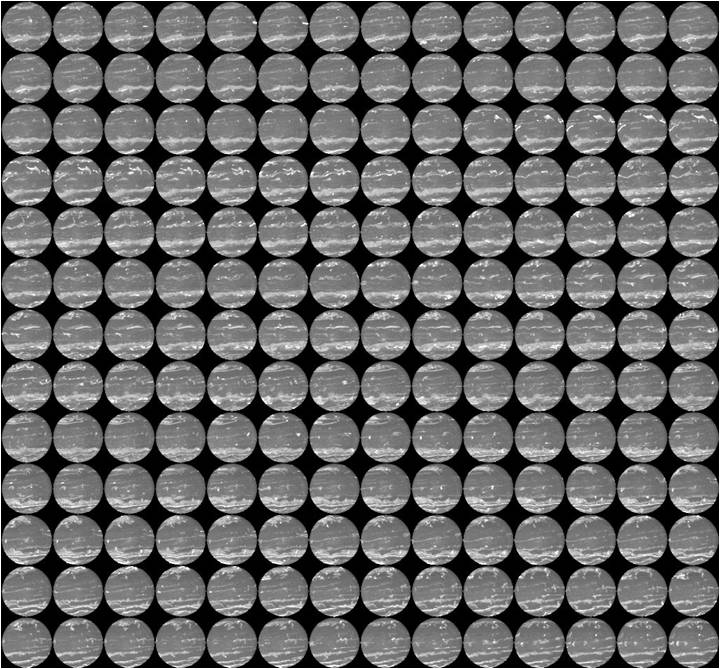
Figure 8-19. Images of Utica/Point Pleasant interval at 5672 ft (Fred Barth No. 3). Left: horizontal sample subcored along bedding planes (1700 slices at a resolution of 42 μm).
Montage of 182 slices through core on Z axis; Right: middle Y-axis slice along length of core plug showing abundant shells.