7.3 Organic Petrography and Thermal Maturity
KGS obtained Utica/Point Pleasant samples from Kentucky, Ohio and Pennsylvania exploration wells and examined them petrographically in reflected light to obtain reflectance measurement data (Ro). Of the approximately 350 samples that were prepared and examined, 90 had sufficient bitumen for reflectance analysis, and are discussed herein.
7.3.1 Materials and Methods
Samples from Kentucky and Ohio consisted of core cuttings and core pieces.
Samples from Pennsylvania consisted of rock cuttings that had been previously reduced in size to -60 mesh (250 μm maximum particle size).
All samples were mixed with epoxy resin and placed into 2.5-, 3.2-, or 3.8-cm diameter phenolic ring form molds, depending on the size of the material.
After curing, the samples were ground and polished using 320, 400 and 600 grit papers, 1.0, 0.03 and 0.05 μm alumina slurries, and 0.05-μm colloidal silica.
Polished samples were air-dried and placed in a desiccator prior to analysis.
Reflected light analysis was performed on a Zeiss UEM microscope, with a Zeiss epiplan 40X oil immersion objective, and a Hamamastu R928 photomultiplier.
The light source for the analysis was supplied by an Osram Xenophot HLX 12V, 100W bulb; Zeiss Immersol oil was used (ne = 1.518, ve = 42).
Random reflectance (Ro random) measurements were collected by first calibrating the system using a glass standard of known reflectance.
Following this, reflectance measurements were collected particles of bitumen, using a 2-μm diameter measuring spot.
In most cases, 30 to 40 measurements were taken for each sample, though this depended on the abundance of bitumen.
In some samples, fewer than 30 particles could be identified and measured.
The average, maximum, minimum, standard deviation and number of measurements were recorded for each sample.
Fluorescent light was used to assist in the identification of organic components.
A Lumen Dynamics 120-watt high pressure metal halide arc lamp was used in conjunction with a Zeiss 09 filter set (450-490 nanometer [nm] excitation,
510 nm beam splitter and 515 nm emission filters).
This particular light/filter configuration makes the liptinitic portion of the organic material fluoresce yellow, orange or red, depending on the level of thermal maturity.
7.3.2 Results
7.3.2.1 Organic Composition of the Utica Shale
Samples with elevated (>2.0 %) TOC contents typically had the most abundant bitumen. Two principle types of bitumen were observed in the samples – grahamite and epi-impsonite, according to the genetic classification of solid bitumen developed by Jacob (1976). Particles of epi-impsonite were selected for measurement, as they had very smooth surfaces. Particles identified as grahamite had coarse-textured surfaces with lower reflectance. It is probable that some fragments of graptolites were also measured, especially as the typical particle size of the bitumen particles was <10 μm.
Bitumen was found to be a minor organic component in these samples. Instead, amorphous organic matter, referred to as amorphinite (Senftle and others, 1987) in this text, is by far the dominant (<75%, mineral matter free) organic component of nearly all of the samples. Amorphinite appears as an organic coating on (mainly) clay grains, and is identified principally by fluorescence. In lower rank samples (Ro 0.6-0.8%), it has a yellow fluorescence, changing to orange and red in higher rank samples (Ro 1.0-1.5%). It cannot be seen in very high rank samples (Ro >1.5%), as fluorescence becomes negligible, and finally disappears.
The association of well-preserved organic material in fine-grained sediments has been discussed by MacQuaker and others (2010). Organic material is enhanced through entombment in a shale-dominant mineral matrix, which protects and preserves the organic material in an otherwise oxygen-rich depositional environment.
Carbonate minerals (mainly calcite) dominate the inorganic matrix of most samples. Occasionally, grains of calcite were observed to fluoresce brightly. Although the cause of this is unclear, it is possible that these grains may have been impregnated with liquid hydrocarbons (paraffinic oils?). Examples of the types of organic material identified from Utica and equivalent samples are provided in Appendix 7-A  (PDF, 952 KB; 11 pages).
7.3.2.2 Bitumen Reflectance and Thermal Maturity
Ro random reflectance measurements collected for the Study ranged from 0.66% to 2.2%, indicating thermal maturity levels from early oil generation to catagenic gas (Dow, 1977; Figure 7-14).
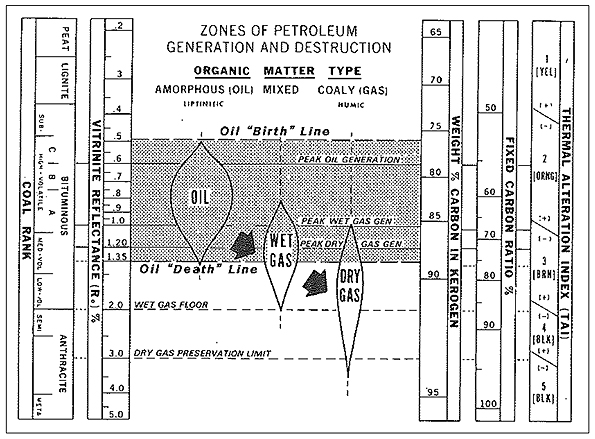
Figure 7-14. Petroleum generation chart, showing the ranges of oil, wet gas and dry gas generation (from Dow, 1977).
In addition to the average, maximum, minimum and standard deviation values measured for these samples, calculated Ro maximum and Ro equivalent values have also been computed. The Ro maximum value is calculated by the following equation from Ting (1978):
Ro maximum = (Ro random * 1.07)
This calculation approximates the Ro maximum measurement that would be obtained by using polarized light, and rotating the stage to obtain a maximum and minimum value, as is a common practice in coal petrology.
The Ro equivalent calculation was developed by Jacob (1989) to account for the fact that bitumen often has a lower reflectance than corresponding vitrinite at the same level of thermal maturity. The equation is as follows:
Ro equivalent = (Ro random * 0.618) + 0.4
7.3.3 Presentation of Results by State
7.3.3.1 Kentucky
Samples from Kentucky were obtained from two boreholes – C-361 from Pulaski County in south-central Kentucky, and C-139 from Boone County in northern Kentucky (Figure 7-15).
The organic-rich sections of these cores were few in number, but contained very abundant and large pieces of bitumen.
Ro random values of 0.74 and 0.76% for C-139 and C-361, respectively, indicating thermal maturity levels in the lower to middle part of the oil window (Table 7-1).
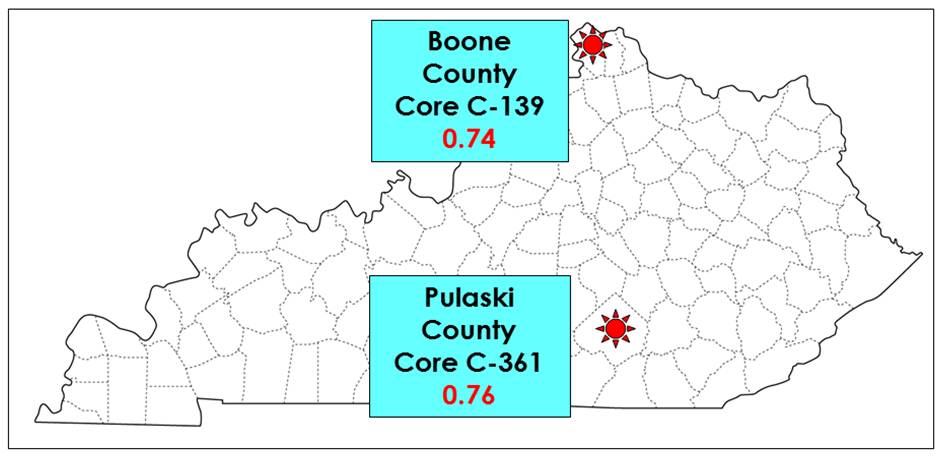
Figure 7-15. Map of Kentucky showing locations of core samples. Average Ro random values for each core are shown in red type.
| Well ID | Sample
Depth (ft) | Random Ro
| Calculated
Ro max | Calculated
Ro eq | No. of
Observations |
|---|
| Avg | Max | Min | Std Dev |
|---|
C-361, Pulaski Co., KY |
| | 1165.8 | 0.74 | 0.81 | 0.67 | 0.04 | 0.79 | 0.86 | 43 |
C-139, Boone, Co., KY |
| | 215 | 0.76 | 0.86 | 0.64 | 0.06 | 0.81 | 0.87 | 47 |
| | 222 | 0.76 | 0.86 | 0.65 | 0.05 | 0.81 | 0.87 | 47 |
| | 226 | 0.76 | 0.83 | 0.69 | 0.04 | 0.82 | 0.87 | 47 |
| Well Average |
| | 0.76 | 0.85 | 0.66 | 0.05 | 0.81 | 0.87 | 47 |
Table 7-1. Reflectance data for Kentucky samples.
7.3.3.2 Ohio
Samples from 12 borehole locations in central Ohio (Figure 7-16) were analyzed.
Boreholes along the western margin of the central Ohio area reported reflectance values from 0.66 to 0.71%.
Borehole locations in the more central and eastern part of this area had reflectance values of 0.76 to 0.84% (Table 7-2).
Collectively, the Utica/Point Pleasant in the central Ohio area has a level of thermal maturity in the lower to middle part of the oil window.
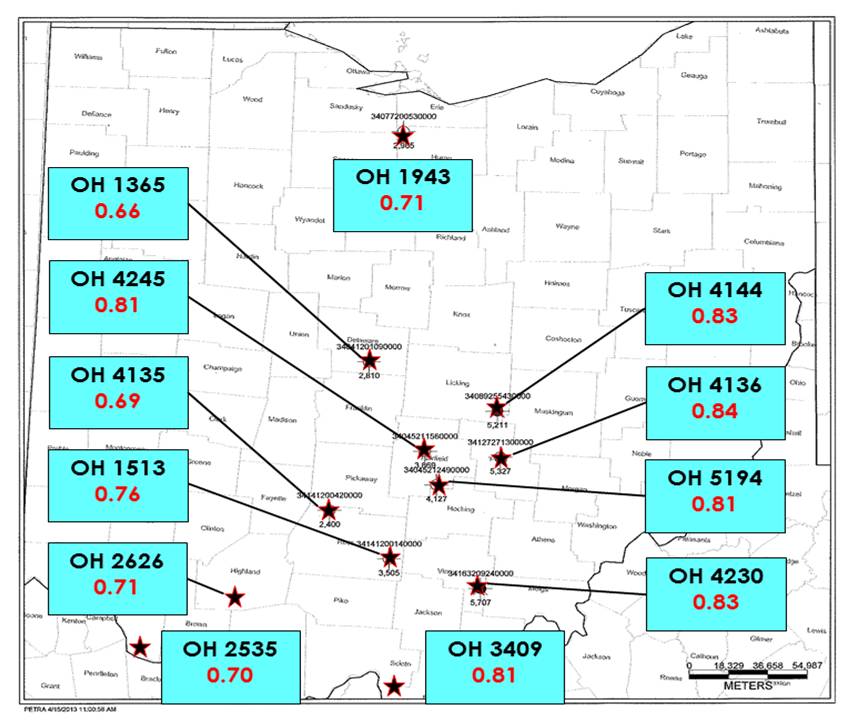
Figure 7-16. Map of Ohio showing locations of core samples. Average Ro random values for each core are shown in red type.
| Well ID | Sample
Depth (ft) | Random Ro
| Calculated
Ro max | Calculated
Ro eq | No. of
Observations |
|---|
| Avg | Max | Min | Std Dev |
|---|
OH1365, Delaware Co., OH |
| | 1932 | 0.66 | 0.77 | 0.54 | 0.05 | 0.71 | 0.81 | 36 |
| | 1961 | 0.67 | 0.77 | 0.57 | 0.06 | 0.71 | 0.81 | 33 |
| | 2014 | 0.67 | 0.80 | 0.51 | 0.09 | 0.71 | 0.81 | 32 |
| | 2067 | 0.63 | 0.74 | 0.51 | 0.06 | 0.68 | 0.79 | 29 |
| | 2077 | 0.65 | 0.75 | 0.53 | 0.05 | 0.70 | 0.80 | 30 |
| | 2142 | 0.66 | 0.76 | 0.57 | 0.05 | 0.70 | 0.81 | 32 |
| Well Average |
| | 0.66 | 0.77 | 0.54 | 0.06 | 0.70 | 0.81 | 32 |
| OH1943, Huron, Co., OH |
| | 1948 | 0.71 | 0.80 | 0.60 | 0.05 | 0.77 | 0.84 | 33 |
| | 1978 | 0.71 | 0.84 | 0.62 | 0.06 | 0.76 | 0.84 | 32 |
| | 2070 | 0.70 | 0.81 | 0.60 | 0.06 | 0.75 | 0.84 | 32 |
| | 2144 | 0.71 | 0.79 | 0.61 | 0.05 | 0.76 | 0.84 | 32 |
| | 2195 | 0.71 | 0.81 | 0.61 | 0.05 | 0.76 | 0.84 | 37 |
| | 2220 | 0.69 | 0.84 | 0.60 | 0.07 | 0.74 | 0.83 | 32 |
| | 2250 | 0.70 | 0.80 | 0.60 | 0.05 | 0.75 | 0.83 | 31 |
| Well Average |
| | 0.71 | 0.81 | 0.61 | 0.06 | 0.76 | 0.84 | 33 |
OH4144, Licking Co., OH |
| | 4110 | 0.82 | 0.93 | 0.65 | 0.08 | 0.88 | 0.91 | 21 |
| | 4120 | 0.86 | 0.93 | 0.78 | 0.05 | 0.92 | 0.93 | 14 |
| | 4200 | 0.84 | 0.95 | 0.65 | 0.08 | 0.90 | 0.92 | 32 |
| | 4250 | 0.86 | 0.99 | 0.76 | 0.06 | 0.92 | 0.93 | 51 |
| | 4360 | 0.83 | 0.95 | 0.70 | 0.06 | 0.88 | 0.91 | 27 |
| | 4390 | 0.83 | 0.94 | 0.66 | 0.08 | 0.89 | 0.91 | 32 |
| | 4420 | 0.82 | 0.94 | 0.74 | 0.06 | 0.88 | 0.91 | 27 |
| | 4450 | 0.83 | 0.96 | 0.70 | 0.06 | 0.88 | 0.91 | 33 |
| Well Average |
| | 0.84 | 0.95 | 0.71 | 0.07 | 0.89 | 0.92 | 30 |
OH5194, Fairfield Co., OH |
| | 3170 | 0.78 | 0.84 | 0.70 | 0.04 | 0.84 | 0.88 | 32 |
| | 3190 | 0.73 | 0.85 | 0.68 | 0.05 | 0.78 | 0.85 | 28 |
| | 3210 | 0.77 | 0.86 | 0.65 | 0.05 | 0.83 | 0.88 | 26 |
| | 3250 | 0.75 | 0.87 | 0.67 | 0.06 | 0.80 | 0.86 | 33 |
| | 3290 | 0.77 | 0.84 | 0.70 | 0.04 | 0.83 | 0.88 | 26 |
| | 3310 | 0.76 | 0.85 | 0.69 | 0.04 | 0.81 | 0.87 | 27 |
| | 3330 | 0.76 | 0.85 | 0.68 | 0.05 | 0.82 | 0.87 | 28 |
| Well Average |
| | 0.76 | 0.85 | 0.68 | 0.05 | 0.81 | 0.87 | 29 |
OH4230, Vinton Co., OH |
| | 4520 | 0.80 | 0.94 | 0.71 | 0.06 | 0.85 | 0.89 | 50 |
| | 4560 | 0.86 | 0.99 | 0.76 | 0.06 | 0.92 | 0.93 | 50 |
| | 4580 | 0.83 | 0.91 | 0.71 | 0.05 | 0.88 | 0.91 | 51 |
| | 4600 | 0.85 | 0.96 | 0.69 | 0.07 | 0.90 | 0.92 | 51 |
| | 4620 | 0.81 | 0.92 | 0.71 | 0.06 | 0.87 | 0.90 | 30 |
| | 4640 | 0.82 | 0.94 | 0.71 | 0.06 | 0.87 | 0.91 | 45 |
| | 4660 | 0.81 | 0.91 | 0.71 | 0.06 | 0.87 | 0.90 | 29 |
| | 4680 | 0.84 | 0.96 | 0.71 | 0.09 | 0.90 | 0.92 | 33 |
| | 4690 | 0.80 | 0.97 | 0.71 | 0.06 | 0.85 | 0.89 | 53 |
| | 4700 | 0.81 | 0.93 | 0.71 | 0.06 | 0.87 | 0.90 | 51 |
| | 4720 | 0.83 | 0.92 | 0.70 | 0.07 | 0.89 | 0.91 | 52 |
| Well Average |
| | 0.82 | 0.94 | 0.71 | 0.06 | 0.88 | 0.91 | 45 |
OH4245, Fairfield Co., OH |
| | 2830 | 0.81 | 0.91 | 0.71 | 0.06 | 0.87 | 0.90 | 28 |
| | 2870 | 0.81 | 0.92 | 0.71 | 0.07 | 0.87 | 0.90 | 32 |
| Well Average |
| | 0.81 | 0.91 | 0.71 | 0.06 | 0.87 | 0.90 | 30 |
OH4135, Ross Co., OH |
| | 2950 | 0.69 | 0.81 | 0.61 | 0.05 | 0.74 | 0.83 | 34 |
OH4136, Perry Co., OH |
| | 4350 | 0.86 | 0.96 | 0.75 | 0.07 | 0.92 | 0.93 | 31 |
| | 4410 | 0.83 | 0.92 | 0.71 | 0.06 | 0.89 | 0.91 | 32 |
| | 4530 | 0.84 | 0.94 | 0.74 | 0.06 | 0.90 | 0.92 | 36 |
| Well Average |
| | 0.84 | 0.94 | 0.73 | 0.06 | 0.90 | 0.92 | 33 |
OH2535, Clermont Co., OH |
| | 67.3 | 0.71 | 0.79 | 0.61 | 0.05 | 0.76 | 0.84 | 34 |
| | 158 | 0.77 | 0.88 | 0.67 | 0.06 | 0.83 | 0.88 | 48 |
| | 178 | 0.75 | 0.84 | 0.59 | 0.08 | 0.80 | 0.86 | 35 |
| | 188 | 0.75 | 0.84 | 0.68 | 0.04 | 0.80 | 0.86 | 38 |
| Well Average |
| | 0.74 | 0.84 | 0.64 | 0.06 | 0.80 | 0.86 | 39 |
OH2626, Highland Co., OH |
| | 1035 | 0.71 | 0.82 | 0.58 | 0.06 | 0.76 | 0.84 | 19 |
| | 1054 | 0.76 | 0.84 | 0.57 | 0.06 | 0.81 | 0.87 | 37 |
| Well Average |
| | 0.73 | 0.83 | 0.58 | 0.06 | 0.78 | 0.85 | 28 |
OH1513, Ross Co., OH |
| | 2550 | 0.76 | 0.89 | 0.69 | 0.06 | 0.81 | 0.87 | 36 |
OH3409, Scioto Co., OH |
| | 2799 | 0.82 | 0.91 | 0.71 | 0.05 | 0.88 | 0.91 | 35 |
| | 2982 | 0.77 | 0.93 | 0.66 | 0.07 | 0.83 | 0.88 | 28 |
| | 3116 | 0.83 | 0.94 | 0.69 | 0.07 | 0.89 | 0.91 | 30 |
| | 3138 | 0.81 | 0.89 | 0.72 | 0.05 | 0.86 | 0.90 | 25 |
| Well Average |
| | 0.81 | 0.92 | 0.69 | 0.06 | 0.86 | 0.90 | 30 |
Table 7-2. Reflectance data for central Ohio samples.
Samples from 15 borehole locations in eastern Ohio (Figure 7-17) also were analyzed. Bitumen reflectance increases rapidly from 0.94% in the westernmost part of this area (location 5483, Wayne County) to 1.43% in the easternmost part of this area (location 5434 in Jefferson County, Table 7-3).
Collectively, the Utica/Point Pleasant in eastern Ohio has a level of thermal maturity that includes the middle and upper portions of the oil window, the wet gas window and the lower part of the dry gas window.
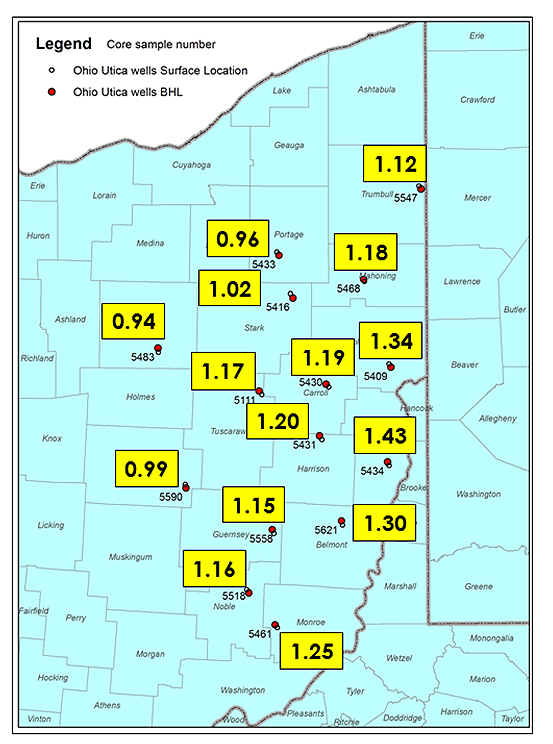
Figure 7-17. Map of eastern Ohio showing locations of core samples. Average Ro random values for each core are shown in in the yellow shaded boxes beside the core location points.
| Well ID | Sample
Depth (ft) | Random Ro
| Calculated
Ro max | Calculated
Ro eq | No. of
Observations |
|---|
| Avg | Max | Min | Std Dev |
|---|
| OH5558, Guernsey Co., OH |
| | 12,970-13,000 | 1.15 | 1.48 | 0.87 | 0.16 | 1.23 | 1.11 | 33 |
| OH5547, Trumball Co., OH |
| | 10,880 | 1.12 | 1.42 | 0.90 | 0.11 | 1.20 | 1.09 | 33 |
| OH5430, Carroll Co., OH |
| | 12,790-13,150 | 1.19 | 1.44 | 0.96 | 0.13 | 1.37 | 1.14 | 37 |
| OH5409, Columbiana Co., OH |
| | 12,920-13,000 | 1.34 | 1.53 | 1.10 | 0.14 | 1.43 | 1.23 | 32 |
| OH5431, Harrison Co., OH |
| | 13,600-13,754 | 1.20 | 1.57 | 0.97 | 0.19 | 1.28 | 1.14 | 35 |
| OH5416, Stark Co., OH |
| | 13,480-13,510 | 1.02 | 1.29 | 0.81 | 0.16 | 1.09 | 1.03 | 43 |
| OH5433, Portage Co., OH |
| | 10,890-10,930 | 0.96 | 1.19 | 0.81 | 0.11 | 1.03 | 0.99 | 40 |
| OH5111, Tuscarawas Co., OH |
| | 12,260-13,342 | 1.17 | 1.39 | 1.00 | 0.11 | 1.25 | 1.12 | 46 |
| OH5468, Mahoning Co., OH |
| | 9940-9958 | 1.18 | 1.46 | 0.96 | 0.14 | 1.26 | 1.13 | 45 |
| OH5483, Wayne Co., OH |
| | 10,100-10,220 | 0.94 | 1.04 | 0.75 | 0.06 | 1.01 | 0.98 | 35 |
| OH5590, Coshocton Co., OH |
| | 10,210-10,450 | 0.99 | 1.22 | 0.85 | 0.09 | 1.06 | 1.01 | 37 |
| OH5621, Belmont Co., OH |
| | 15,210-15,300 | 1.30 | 1.55 | 1.10 | 0.12 | 1.39 | 1.20 | 39 |
| OH5434, Jefferson Co., OH |
| | 14,970-14,990 | 1.43 | 1.61 | 1.17 | 0.12 | 1.54 | 1.29 | 38 |
| OH5518, Noble Co., OH |
| | 12,700-12,800 | 1.16 | 1.48 | 0.91 | 0.16 | 1.24 | 1.12 | 47 |
| OH5461, Monroe, Co., OH |
| | 8710-8800 | 1.25 | 1.51 | 1.12 | 0.11 | 1.34 | 1.17 | 48 |
Table 7-3. Reflectance data for northeastern Ohio samples.
7.3.3.3 Pennsylvania
Rock cuttings samples from four wells located in western Pennsylvania (Figure 7-18) were analyzed.
Samples from the Kardosh No. 1 in Crawford County were the most thermally immature, with an average Ro random of 1.08%.
Samples from the Martin No. 1 in Armstrong County were the most thermally mature, with an average Ro random of 2.19%.
Samples from the Starvaggi No. 1 in Washington County, at a depth from 10,610 to 10,840 ft, had an average Ro random of 1.79%.
Collectively, the Utica/Point Pleasant in western Pennsylvania has a level of thermal maturity that ranges from the upper part of the oil window to the top of the dry gas window (Table 7-4).
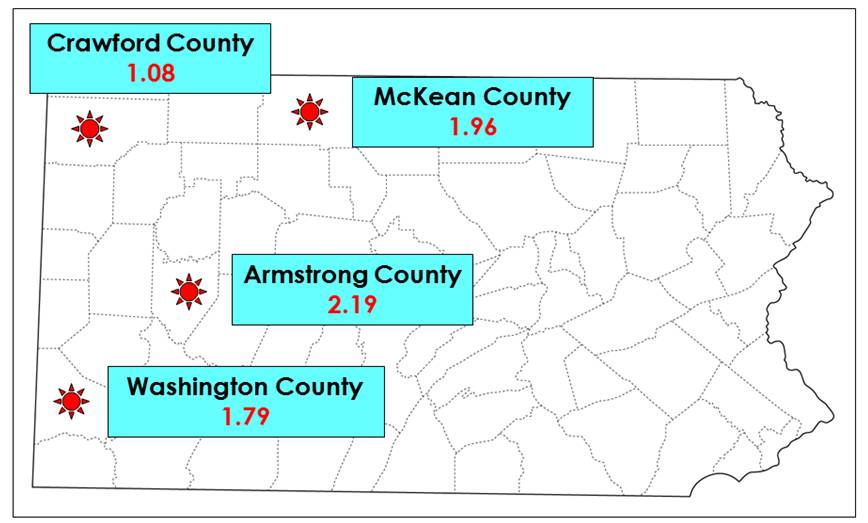
Figure 7-18. Map of Pennsylvania showing locations of well cuttings samples. Average Ro random values for each location are shown in red type.
| Well ID | Sample
Depth (ft) | Random Ro
| Calculated
Ro max | Calculated
Ro eq | No. of
Observations |
|---|
| Avg | Max | Min | Std Dev |
|---|
| Martin No. 1, Armstrong Co., PA |
| | 11,860-11,870 | 2.22 | 2.60 | 1.81 | 0.22 | 2.37 | 1.77 | 39 |
| | 2,010-12,020 | 2.17 | 2.60 | 1.83 | 0.22 | 2.32 | 1.74 | 38 |
| Well Average |
| | 2.19 | 2.60 | 1.82 | 0.22 | 2.35 | 1.76 | 39 |
| Kardosh No. 1, Crawford Co., PA |
| | 5950-5960 | 1.09 | 1.32 | 0.88 | 0.12 | 1.17 | 1.08 | 35 |
| | 5990-6000 | 1.10 | 1.36 | 0.86 | 0.13 | 1.18 | 1.08 | 34 |
| | 6160-6170 | 1.06 | 1.25 | 0.90 | 0.09 | 1.13 | 1.05 | 34 |
| Well Average |
| | 1.08 | 1.31 | 0.88 | 0.11 | 1.16 | 1.07 | 34 |
| Say No. 1, McKean Co., PA |
| | 9070-9080 | 1.96 | 2.20 | 1.72 | 0.14 | 2.10 | 1.61 | 37 |
| | 9090-9100 | 1.97 | 2.22 | 1.72 | 0.16 | 2.11 | 1.62 | 33 |
| | 9100-9110 | 1.96 | 2.37 | 1.69 | 0.20 | 2.09 | 1.61 | 35 |
| Well Average |
| | 1.96 | 2.26 | 1.71 | 0.17 | 2.10 | 1.61 | 35 |
| FEI Starvaggi No. 1, Washington Co., PA |
| | 10,610 | 1.78 | 2.02 | 1.61 | 0.15 | 1.90 | 1.50 | 45 |
| | 10,730 | 1.81 | 2.08 | 1.50 | 0.17 | 1.94 | 1.52 | 42 |
| | 10,740 | 1.76 | 2.10 | 1.57 | 0.17 | 1.88 | 1.49 | 37 |
| | 10,810 | 1.81 | 2.08 | 1.54 | 0.16 | 1.94 | 1.52 | 32 |
| | 10,830 | 1.80 | 2.05 | 1.61 | 0.14 | 1.93 | 1.51 | 35 |
| | 10,840 | 1.79 | 2.09 | 1.57 | 0.15 | 1.92 | 1.51 | 45 |
| Well Average |
| | 1.79 | 2.07 | 1.57 | 0.16 | 1.92 | 1.51 | 39 |
Table 7-4. Reflectance data for Pennsylvania samples.
A sample of the geologically younger Marcellus Formation from Washington County (API# 3712520552), located at a depth of 6450 ft, also was analyzed for comparison purposes. This sample reported a Ro random value of 1.39%. In addition, the Pittsburgh coal bed, which occurs within 500 ft of ground surface across Washington County, has an Ro random of 0.8 to 0.85% (Ruppert and others, 2010). Collectively, this indicates a random reflectance increase of about 1.0% over a depth range of about 10,000 ft in southwestern Pennsylvania (Figure 7-19).
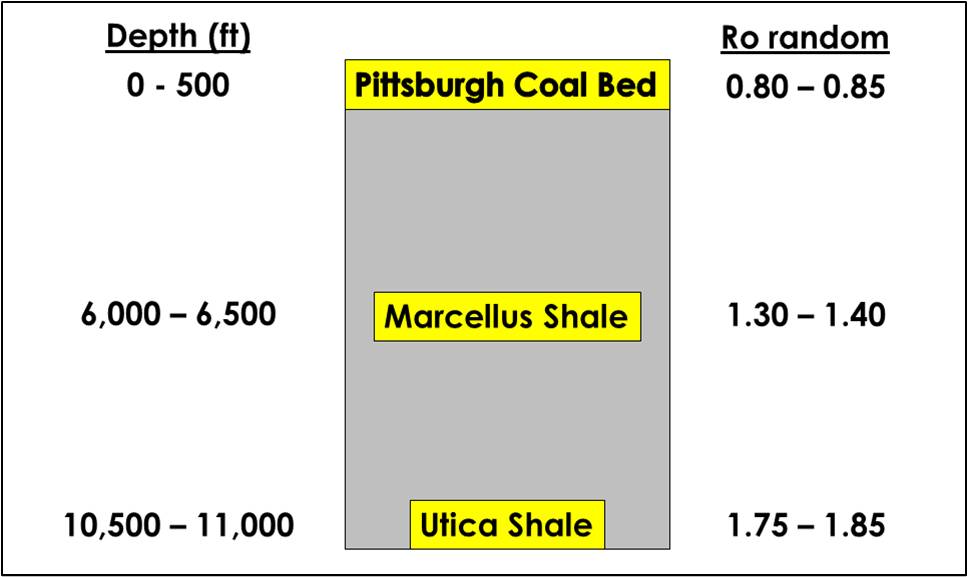
Figure 7-19. Reflectance measurements for discrete depth intervals in Washington County, Pennsylvania, showing a change of approximately 1.0% Ro over a depth of about 10,000 ft.
7.3.4 Discussion
The organic matter composition of the Utica/Point Pleasant is uniformly dominated by amorphinite, which indicates an algal source for much,
if not most, of the organic material in the rocks.
Organic-rich intervals within the Utica/Point Pleasant have a greater proportion of shale in the inorganic matrix, with the organic material occurring most frequently in association with shale lithologies.
Organic-poor intervals are usually carbonate-mineral dominant.
The level of thermal maturity in the Utica/Point Pleasant shows a progression in increasing bitumen reflectance from west to east, with a very steep increase occurring in eastern Ohio.
This is mainly the result of a rapid increase in depth of the Utica/Point Pleasant in this area.
In central Ohio, the Utica/Point Pleasant was sampled at depths from less than 100 ft in Clermont County (OH2535) to about 4800 ft in Vinton County (OH4230).
Ro random values from central Ohio ranged from 0.66 to 0.84%.
In eastern Ohio, sample depths ranged from 8700 ft to more than 15,000 ft, with Ro values ranging from 0.94 to 1.43%.
As such, it is not surprising that the eastern Ohio area is more thermally mature.
Two thermal maturity maps with isoreflectance lines (one for central Ohio and another for eastern Ohio) are provided in Figures 7-20 and 7-21, respectively.
These agree well with a previously published map for this area of the basin (ODNR, 2013).
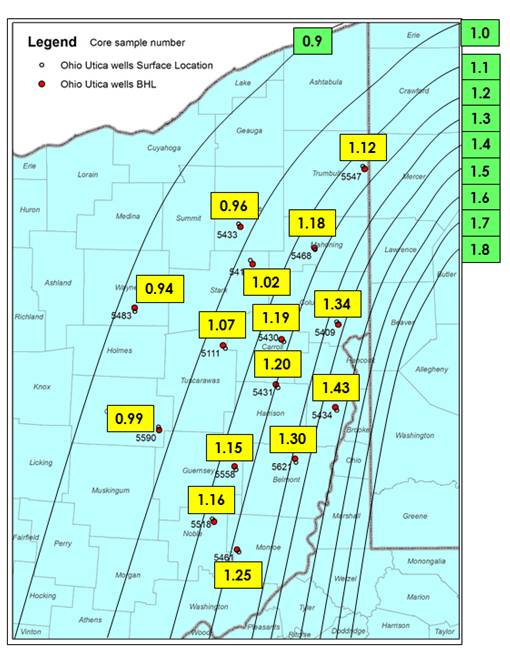
Figure 7-20. Map of eastern Ohio showing isoreflectance lines.
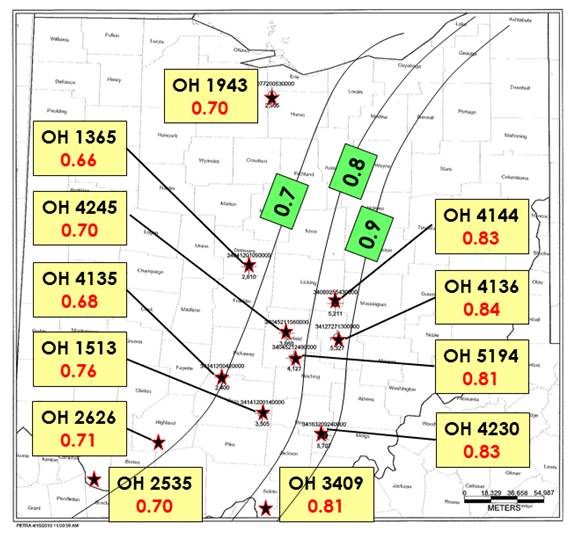
Figure 7-21. Map of Ohio showing isoreflectance lines for the central part of the state.
7.3.5 Characterizing Reservoir Quality Using Mineralogy, TOC and Bitumen Reflectance
This particular task builds on work previously conducted by Cooney (2013) regarding thermal maturity trends of the Utica Shale Play in Pennsylvania.
Cooney (2013) (see Appendix 7-B  (PDF, 3.41 MB; 95 pages)) found that although mineralogy varied significantly between the Utica and Point Pleasant formations
(higher carbonate in the Point Pleasant versus higher quartz and clay in the Utica), reflectance measurements collected for each interval remained
very similar at most locations and did not necessarily increase with depth.
Reflectance values did increase from west to east across Pennsylvania, which agrees with earlier thermal maturity studies.
Since composite samples were taken in 50-ft intervals, they did not necessarily reflect small-scale variations in organic-richness that may be present within each formation,
and thus, a much more detailed sample set, with formations sampled every 10 ft, was warranted for this follow-on work.
For the current task, the research team explored potential relationships among Utica and Point Pleasant mineralogy,
organic content and bitumen reflectance, as well as potential trends among these parameters with well depth.
Samples were collected from several wells across Pennsylvania, where thermal maturity has been shown to span from the oil window through the dry gas window.
7.3.5.1 Materials and Methods
Samples from several wells penetrating the Utica/Point Pleasant were collected from the PAGS rock cuttings repository for this work.
In an initial study by Cooney (2013), rock cuttings from six different wells were sampled at 50-ft intervals from the top, middle and base of the Kope, Utica and Point Pleasant formations, where present (Table 7-6).
Shale samples (3 to 5 g each) were collected every 10 ft along each 50-ft sampling interval, and then composited to make one representative sample for that interval.
For the current Study, five additional well locations were chosen for analysis, and one well from the initial study was reexamined (Figure 7-22).
For these locations, rock cuttings were sampled every 10 ft from the inorganic shale just above the Utica (i.e., Kope Formation) to the Lexington/Trenton Formation below the base of the Utica/Point Pleasant (Table 7-5).
| API No. | Well Name | County | Cooney (2013)1
Depth (ft) | Play Book Study2
Depth (ft) |
|---|
| 3700521201 | Martin No. 1 | Armstrong | 10,850-11,900 | NA |
| 3702720001 | Long No. 1 | Centre | 13,800-14,250 | NA |
| 3703920007 | Kardosh No. 1 | Crawford | 5500-6200 | NA |
| 3704920049 | PA Dept. of Forests & Waters Block 2 No. 1 | Erie | NA | 3715-4010 |
| 3706720001 | Shade Mt. No. 1 | Juniata | NA | 3690-3780 |
| 3708520116 | Fleck No. 1 | Mercer | 6930-7100 | NA |
| 3711120045 | Svetz No. 1 | Somerset | NA | 15,000-15,160 |
| 3711320002 | Dieffenbach No. 2951 | Sullivan | 16,200-16,350 | NA |
| 3711720181 | Marshlands No. 2 | Tioga | NA | 11,660-12,030 |
| 3712320150 | Shaw No. 1 | Warren | 8100-8300 | 8047-8362 |
| 3712522278 | Starvaggi No. 1 | Washington | NA | 10,030-11,000 |
Table 7-5. Summary of sampling intervals for preliminary work conducted by Cooney (2013) and those of the current Study.
1 – 50-ft sample interval: top, middle and base of each formation
2 – 10-ft sample interval
NA – not analyzed
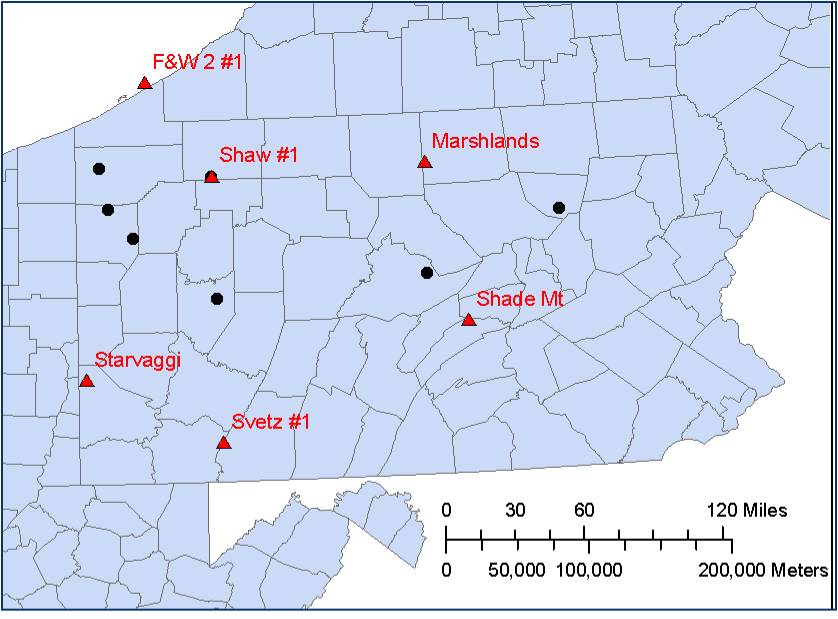
Figure 7-22. Map of Pennsylvania showing sample locations utilized by Cooney (2013) in a preliminary study of Utica/Point Pleasant thermal maturity (black circles), and those used in the current Study (red triangles).
Each sample was ground with a mortar and pestle and sieved through a #16 sieve. Approximately 2 g of sample were added to roughly 3 g of Beuhler TransOptic powder (20-3400-080) and mixed.
The sample and powder were then placed into a Beuhler Simplimet 3000 Automatic Mounting Press and run for 15.5 minutes at 4000 pounds per square inch (psi) to form solid sample plugs for reflectance analysis.
After sitting overnight in a desiccator, the plugs were polished using a Beuhler Ecomet 300 and six polishing pads of varying coarseness. Each plug was analyzed using a Leica DMRX microscope which was calibrated
using a (YAG) [0.901] or (GGG) [1.719] standard with MSP200V4.3 and AxioVision software.
Using immersion oil and an oil objective, samples were visually assessed for bitumen using the American Society for Testing and Materials (ASTM) standard D2797.
As many measurements as possible were made on macerals of sufficient size.
Using the ASTM 7708 template, data were placed into a histogram that included three category divisions: coked bitumen, degraded bitumen, and homogeneous bitumen.
The resulting data are provided in Appendix 7-C  (PDF, 4.38 MB; 171 pages).
7.3.5.2 Results
Click on header below to expand results for listed well/bore.
PA Dept. of Forests & Waters Block 2 No.1 (API #3704920049)
Bitumen reflectance samples were collected from the PA Dept. of Forests & Waters Block 2 No. 1 well in Erie County,
Pennsylvania, over a 295-ft depth range, spanning from the Kope Formation through the upper portion of the Trenton/Lexington Formation (Table 7-6).
Reflectance measurements could not be made for many of these intervals due to lack of bitumen and/or insufficient maceral size.
In those intervals where bitumen was present, the number of observations made was limited (Table 7-6).
Depth
(ft) | Formation | Bulk Mineralogy | TOC (%) | Bitumen Reflectance |
|---|
Quartz+
(%) | Clay
(%) | Carbonate
(%) | Mean
BRo (%) | No. of
Observations (N) |
|---|
| 3715 | Kope | 42 | 55 | 3 | NA | 1.10 | 1 |
| 3770 | Kope | 28 | 66 | 6 | NA | 0.98 | 2 |
| 3795 | Kope | 28 | 66 | 7 | NA | 1.01 | 2 |
| 3810 | Utica | 32 | 62 | 6 | NA | 0.96 | 3 |
| 3824 | Utica | 30 | 64 | 6 | NA | 1.10 | 5 |
| 3843 | Utica | 26 | 67 | 8 | NA | 0.94 | 4 |
| 3869 | Utica | 35 | 56 | 9 | NA | 1.08 | 2 |
| 3890 | Utica | 27 | 66 | 7 | NA | 0.92 | 1 |
| 3895 | Utica | 28 | 68 | 4 | NA | 1.50 | 4 |
| 3911 | Utica | 31 | 67 | 2 | NA | 1.58 | 3 |
| 3930 | Utica | 23 | 58 | 19 | NA | 1.92 | 1 |
| 3966 | Lexington/Trenton | 26 | 48 | 26 | NA | 1.95 | 1 |
| 3985 | Lexington/Trenton | 18 | 24 | 58 | NA | 2.01 | 1 |
| 3993 | Lexington/Trenton | 16 | 26 | 58 | NA | 1.56 | 1 |
| 4010 | Lexington/Trenton | 15 | 14 | 70 | NA | 2.09 | 1 |
Table 7-6. Mineralogy, TOC and Reflectance Data for PA Dept. of Forest & Waters Block 2 No. 1.
NA – not analyzed
In general, reflectance increases with depth, with a cluster of relatively high measurements (1.5-2.0% BRo) reported near the base of the Utica Shale (3895 ft) through the top of the Lexington/Trenton Formation (4010 ft). This notable increase in measured reflectance values in the lower Utica occurs about 50 ft shallower than any changes in mineralogy (Table 7-6).
The Point Pleasant Formation is not present in this area of Pennsylvania, so the Utica and Lexington/Trenton formations are in direct, disconformable contact with one another at this location.
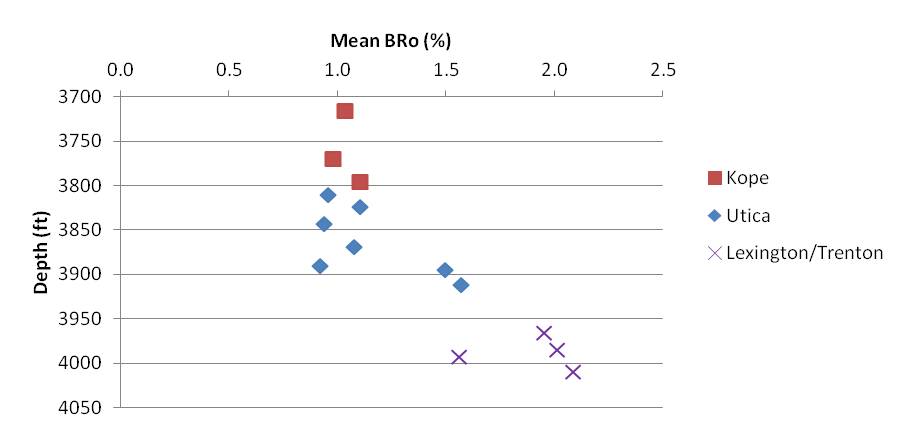
Figure 7-23. Crossplot of mean reflectance measurements (BRo%) versus depth in the PA Dept. of Forests & Waters Block 2 No. 1 well, Erie County, Pennsylvania. Reflectance generally increases with depth.
A tabular summary of the mean bitumen reflectance values (by formation) is provided in Table 7-7. The mean BRo measured in this well is 1.38%.
| Formation | Mean BRo
(%) | Mean No. of
Observations (N) |
|---|
| Kope | 1.03 | 1.7 |
| Utica | 1.25 | 3.1 |
| Lexington/Trenton | 1.90 | 1.0 |
| Well Mean | 1.38 | 2.1 |
Table 7-7. Mean reflectance (BRo%) by formation, PA Dept. of Forests & Waters Block 2 No. 1.
Shaw No.1 (API #3712320150)
Bitumen reflectance samples were collected from the Shaw No. 1 well in Warren County, Pennsylvania, over a 315-ft range spanning from the Utica Shale through the upper Lexington/Trenton Formation (Figure 7-24). The number of reflectance measurements that could be made was limited, but macerals of measureable size were more abundant in this well than in samples collected from PA Dept. of Forest & Waters Block No. 1 in neighboring Erie County. In general, intervals of high and low reflectance were found in all three formations. The most measureable macerals occurred at the bottom of the Point Pleasant Formation (8300 to 8375 ft), directly on top of the Lexington/Trenton Formation, which alludes to a relatively organic-rich zone in this part of the interval. A similar cluster of relatively higher N values is found at the bottom of the Utica Shale and into the top of the Point Pleasant.
There does not appear to be any correlation between intervals of higher reflectance and mineralogical variations (Table 7-8). Even so, where the highest number of measureable macerals were encountered (i.e., at the base of the Utica and Point Pleasant formations), a noticeable change in mineralogy takes place (increasing carbonate, decreasing clay). Overall, reflectance increases with depth (Table 7-8).
Depth
(ft) | Formation | Bulk Mineralogy | TOC1 (%) | Bitumen Reflectance |
|---|
Quartz+
(%) | Clay
(%) | Carbonate
(%) | Mean
BRo (%) | No. of
Observations (N) |
|---|
| 8047 | Utica | 32 | 62 | 6 | NA | 1.13 | 3 |
| 8057 | Utica | 31 | 61 | 8 | NA | 1.21 | 6 |
| 8066 | Utica | 26 | 67 | 7 | NA | 1.75 | 6 |
| 8074 | Utica | 30 | 61 | 10 | NA | 1.76 | 5 |
| 8087 | Utica | 26 | 61 | 13 | NA | 1.63 | 4 |
| 8094 | Utica | 28 | 62 | 10 | NA | 1.73 | 3 |
| 8108 | Utica | 29 | 64 | 8 | NA | 2.02 | 3 |
| 8117 | Utica | 28 | 64 | 8 | NA | 1.72 | 3 |
| 8120 | Utica | 30 | 63 | 7 | NA | 1.51 | 1 |
| 8126 | Utica | 30 | 63 | 7 | NA | 1.81 | 5 |
| 8136 | Utica | 31 | 65 | 5 | NA | 1.70 | 7 |
| 8141 | Utica | 32 | 64 | 4 | NA | 1.57 | 3 |
| 8146 | Utica | 33 | 57 | 10 | NA | 1.45 | 4 |
| 8161 | Utica | 29 | 57 | 14 | NA | 1.65 | 9 |
| 8168 | Utica | 29 | 52 | 19 | NA | 1.60 | 7 |
| 8170 | Point Pleasant | 24 | 52 | 24 | NA | 1.35 | 1 |
| 8197 | Point Pleasant | 30 | 49 | 20 | NA | 1.86 | 7 |
| 8210 | Point Pleasant | 35 | 42 | 23 | NA | 1.90 | 8 |
| 8220 | Point Pleasant | 34 | 36 | 20 | NA | 1.79 | 3 |
| 8227 | Point Pleasant | 30 | 48 | 22 | NA | 1.64 | 5 |
| 8240 | Point Pleasant | 35 | 43 | 22 | NA | 2.10 | 2 |
| 8250 | Point Pleasant | 31 | 50 | 20 | NA | 1.93 | 2 |
| 8263 | Point Pleasant | 28 | 46 | 26 | NA | 1.84 | 3 |
| 8272 | Point Pleasant | 27 | 52 | 21 | NA | 1.70 | 3 |
| 8282 | Point Pleasant | 35 | 37 | 28 | NA | 1.62 | 10 |
| 8288 | Point Pleasant | 31 | 45 | 24 | NA | 1.75 | 18 |
| 8296 | Point Pleasant | 25 | 51 | 25 | NA | 1.78 | 15 |
| 8303 | Lexington/Trenton | 21 | 49 | 30 | NA | 1.55 | 5 |
| 8313 | Lexington/Trenton | 25 | 20 | 55 | NA | 1.85 | 6 |
| 8317 | Lexington/Trenton | 13 | 7 | 80 | NA | 1.79 | 13 |
| 8321 | Lexington/Trenton | 14 | 5 | 80 | NA | 1.85 | 4 |
| 8326 | Lexington/Trenton | 11 | 81 | 8 | NA | 1.77 | 9 |
| 8333 | Lexington/Trenton | 8 | 20 | 72 | NA | 1.77 | 6 |
| 8339 | Lexington/Trenton | 7 | 6 | 87 | NA | 1.83 | 2 |
| 8347 | Lexington/Trenton | 9 | 6 | 86 | NA | 1.79 | 5 |
| 8356 | Lexington/Trenton | 10 | 8 | 82 | NA | 1.83 | 9 |
| 8362 | Lexington/Trenton | 5 | 4 | 91 | NA | 1.77 | 8 |
| 8369 | Lexington/Trenton | 5 | 5 | 90 | NA | 1.96 | 3 |
Table 7-8. Mineralogy, TOC and Reflectance Data for Shaw No. 1.
1 – TOC samples were taken from this well in 50-ft intervals by Cooney (2013). TOC results were as follows: 0.20% at 7600-7650 ft (Kope Formation); 1.20% at 8100-8150 ft (Utica Shale); and 1.54% at 8250-8300 ft (Point Pleasant Formation).
NA – not analyzed
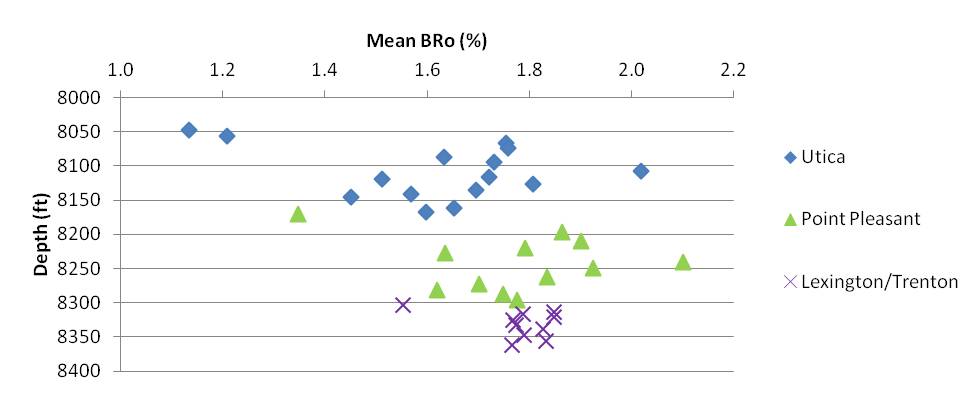
Figure 7-24. Crossplot of mean reflectance measurements (BRo%) versus depth in the Shaw No. 1 well, Warren County, Pennsylvania. Many BRo values fall in the 1.5 to 2.0% range, regardless of formation or depth.
A tabular summary of the mean bitumen reflectance values (by formation) is provided in Table 7-9. The mean BRo measured in this well is 1.72%.
| Formation | Mean BRo
(%) | Mean No. of
Observations (N) |
|---|
| Utica | 1.62 | 4.6 |
| Point Pleasant | 1.77 | 6.4 |
| Lexington/Trenton | 1.80 | 6.4 |
| Well Mean | 1.72 | 5.8 |
Table 7-9. Mean reflectance (BRo%) by formation, Shaw No. 1.
Starvaggi No.1 (API #3712522278)
Bitumen reflectance measurements were collected from the Starvaggi No. 1 well in Washington County, Pennsylvania, over a 970-ft range that included multiple formations: the Kope, Utica, Point Pleasant and Lexington/Trenton. Generally, intervals of high reflectance are found at various depths throughout the well, but intervals with the highest numbers of measureable macerals were found in the lower Utica Shale and interspersed throughout the Point Pleasant Formation (Table 7-10). Elevated TOC values are coincident with sample intervals having the largest number of maceral observations.
Depth
(ft) | Formation | Bulk Mineralogy | TOC (%) | Bitumen Reflectance |
|---|
Quartz+
(%) | Clay
(%) | Carbonate
(%) | Mean
BRo (%)1 | No. of
Observations (N) |
|---|
| 10030 | Kope | 35 | 48 | 17 | 0.48 | 0.67 | 1 |
| 10060 | Kope | 25 | 48 | 27 | 0.41 | 0.59 | 2 |
| 10100 | Kope | 30 | 51 | 19 | 0.39 | 0.91 | 3 |
| 10200 | Kope | 30 | 63 | 7 | 0.31 | 1.12 | 1 |
| 10210 | Kope | 25 | 66 | 9 | 0.36 | 0.86 | 7 |
| 10230 | Kope | 32 | 54 | 14 | 0.38 | 1.06 | 3 |
| 10240 | Kope | 30 | 55 | 15 | 0.41 | 1.03 | 3 |
| 10260 | Kope | 32 | 53 | 16 | 0.37 | 1.36 | 1 |
| 10270 | Kope | 29 | 60 | 12 | 0.38 | 1.10 | 20 |
| 10300 | Kope | 27 | 56 | 17 | 0.39 | 1.11 | 2 |
| 10310 | Kope | 32 | 49 | 19 | 0.47 | 1.00 | 4 |
| 10320 | Kope | 26 | 61 | 12 | 0.41 | 0.91 | 2 |
| 10330 | Kope | 26 | 61 | 13 | 0.45 | 0.73 | 1 |
| 10340 | Kope | 29 | 58 | 13 | 0.46 | 0.85 | 2 |
| 10350 | Kope | 36 | 48 | 15 | 0.47 | 0.92 | 2 |
| 10360 | Kope | 27 | 64 | 9 | 0.50 | 0.71 | 1 |
| 10370 | Utica | 29 | 59 | 12 | 0.48 | 0.93 | 7 |
| 10380 | Utica | 29 | 61 | 10 | 0.55 | 0.99 | 6 |
| 10390 | Utica | 27 | 64 | 9 | 0.62 | 1.01 | 10 |
| 10400 | Utica | 27 | 62 | 11 | 0.53 | 1.06 | 3 |
| 10410 | Utica | 27 | 63 | 10 | 0.61 | 1.01 | 4 |
| 10420 | Utica | 30 | 62 | 8 | 0.53 | 1.21 | 5 |
| 10430 | Utica | 38 | 51 | 11 | 0.47 | 1.09 | 3 |
| 10440 | Utica | 31 | 59 | 10 | 0.61 | 0.97 | 5 |
| 10450 | Utica | 34 | 54 | 13 | 0.67 | 1.06 | 10 |
| 10460 | Utica | 29 | 61 | 9 | 0.62 | 1.22 | 13 |
| 10470 | Utica | 27 | 65 | 8 | 0.50 | 0.93 | 7 |
| 10480 | Utica | 31 | 58 | 12 | 0.55 | 0.84 | 1 |
| 10490 | Utica | 30 | 61 | 9 | 0.55 | NA | |
| 10500 | Utica | 32 | 57 | 12 | 0.55 | 1.02 | 3 |
| 10510 | Utica | 24 | 62 | 14 | 0.85 | 0.89 | 3 |
| 10520 | Utica | 28 | 62 | 11 | 0.64 | 0.95 | 11 |
| 10530 | Utica | 25 | 62 | 12 | 0.94 | 1.08 | 1 |
| 10540 | Utica | 29 | 59 | 12 | 1.49 | 1.00 | 24 |
| 10550 | Utica | 27 | 60 | 13 | 1.65 | 0.97 | 25 |
| 10560 | Utica | 28 | 60 | 12 | 1.98 | 0.98 | 14 |
| 10570 | Utica | 28 | 58 | 14 | 1.96 | 1.06 | 11 |
| 10580 | Utica | 27 | 60 | 14 | 2.18 | 1.10 | 16 |
| 10590 | Utica | 29 | 54 | 18 | 1.32 | 1.06 | 21 |
| 10600 | Utica | 27 | 61 | 12 | 1.32 | 1.04 | 10 |
| 10610 | Utica | 26 | 60 | 14 | 1.57 | 0.96 | 3 |
| 10620 | Utica | 30 | 53 | 17 | 1.43 | 1.16 | 1 |
| 10630 | Utica | 25 | 57 | 18 | 1.61 | 1.14 | 6 |
| 10640 | Utica | 31 | 53 | 16 | 0.99 | 1.11 | 6 |
| 10650 | Utica | 30 | 57 | 13 | 1.25 | 1.31 | 4 |
| 10660 | Utica | 28 | 58 | 13 | 1.21 | 1.20 | 3 |
| 10680 | Utica | 24 | 64 | 12 | 1.11 | 0.90 | 5 |
| 10690 | Utica | 25 | 62 | 13 | 1.77 | 1.06 | 26 |
| 10700 | Utica | 28 | 53 | 20 | 2.31 | 1.07 | 8 |
| 10710 | Utica | 24 | 47 | 29 | 2.20 | 1.00 | 12 |
| 10720 | Utica | 21 | 40 | 39 | 2.93 | 1.10 | 14 |
| 10730 | Utica | 20 | 34 | 46 | 3.71 | 1.00 | 30 |
| 10740 | Utica | 23 | 32 | 46 | 3.46 | 0.97 | 13 |
| 10750 | Utica | 21 | 28 | 51 | 4.11 | 0.97 | 20 |
| 10760 | Point Pleasant | 30 | 14 | 56 | 3.95 | 1.07 | 24 |
| 10770 | Point Pleasant | 33 | 12 | 55 | 4.19 | 0.94 | 38 |
| 10780 | Point Pleasant | 28 | 10 | 62 | 3.67 | 1.00 | 39 |
| 10790 | Point Pleasant | 20 | 5 | 75 | 3.34 | 1.00 | 35 |
| 10800 | Point Pleasant | 18 | 8 | 74 | 2.70 | 0.99 | 8 |
| 10810 | Point Pleasant | 13 | 9 | 78 | 3.04 | 1.06 | 13 |
| 10820 | Point Pleasant | 16 | 7 | 78 | 2.88 | 1.04 | 5 |
| 10830 | Point Pleasant | 12 | 6 | 82 | 3.52 | 0.96 | 23 |
| 10840 | Point Pleasant | 18 | 6 | 77 | 3.39 | 1.01 | 8 |
| 10850 | Point Pleasant | 16 | 9 | 75 | 1.51 | 0.97 | 13 |
| 10860 | Lexington/Trenton | 5 | 5 | 90 | 0.94 | 0.94 | 4 |
| 10900 | Lexington/Trenton | 24 | 0 | 75 | 1.02 | 0.95 | 16 |
| 10920 | Lexington/Trenton | 23 | 6 | 71 | 1.61 | 1.01 | 32 |
| 10950 | Lexington/Trenton | 19 | 8 | 73 | 0.65 | 1.04 | 6 |
| 10960 | Lexington/Trenton | 21 | 9 | 70 | 0.95 | 0.94 | 25 |
| 10970 | Lexington/Trenton | 22 | 2 | 75 | 0.79 | 0.99 | 27 |
| 10980 | Lexington/Trenton | 19 | 5 | 76 | 0.85 | 1.09 | 29 |
| 10990 | Lexington/Trenton | 24 | 2 | 74 | 0.88 | 1.03 | 27 |
| 11000 | Lexington/Trenton | 12 | 7 | 82 | 1.20 | 1.05 | 41 |
Table 7-10. Mineralogy, TOC and Reflectance Data for Starvaggi No. 1.
1 – BRo measurements reported for this well are suspect, based on review of other measurements prepared by this Study. See Section 7.3.5.3 below.
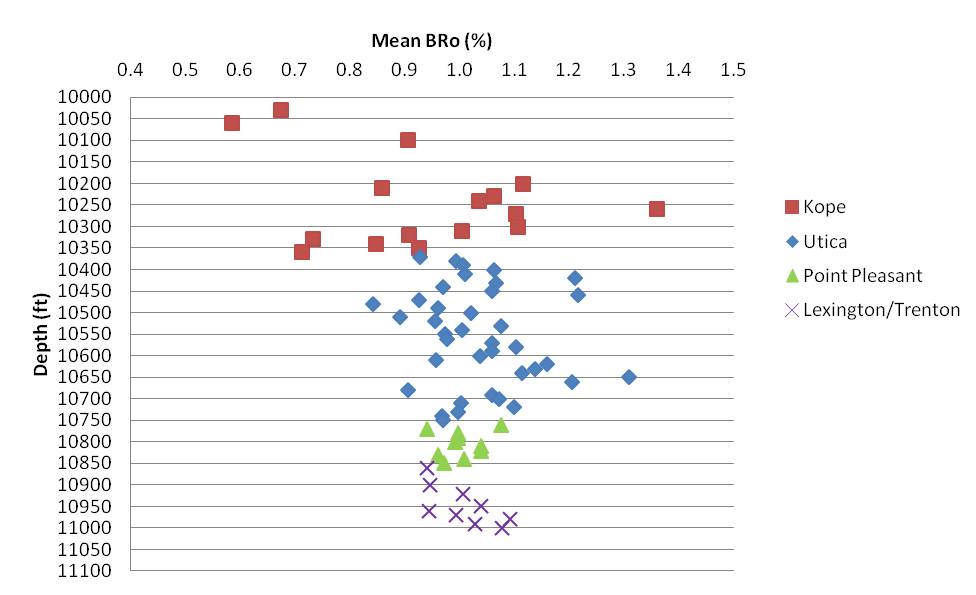
Figure 7-25. Crossplot of mean reflectance measurements (BRo%) versus depth in the Starvaggi No. 1 well, Washington County, Pennsylvania. Many BRo values fall in the 0.8 to 1.2% range, regardless of formation or depth.
A tabular summary of the mean bitumen reflectance values (by formation) is provided in Table 7-11. The mean BRo measured in this well is 1.01%.
| Formation | Mean BRo
(%) | Mean No. of
Observations (N) |
|---|
| Kope | 0.93 | 3.4 |
| Utica | 1.04 | 9.7 |
| Point Pleasant | 1.00 | 20.6 |
| Lexington/Trenton | 1.00 | 23 |
| Well Mean | 1.01 | 11.5 |
Table 7-11. Mean reflectance (BRo%) by formation, Starvaggi No. 1.
Marshlands No. 2 (API #3711720181)
Bitumen reflectance measurements were collected from the Marshlands No. 2 well in Tioga County, Pennsylvania, over a 370-ft interval that includes the Utica Shale and Point Pleasant Formation. Reflectance gradually increases with depth in the Utica Shale, and decreases at the top of the Point Pleasant Formation.
The sharp increase in reflectance values in the lower Utica (11,900 ft) directly coincides with a significant change in mineralogy, where carbonate increases and clay and quartz minerals begin to decrease (Table 7-12).
Depth
(ft) | Formation | Bulk Mineralogy | TOC (%) | Bitumen Reflectance |
|---|
Quartz+
(%) | Clay
(%) | Carbonate
(%) | Mean
BRo (%) | No. of
Observations (N) |
|---|
| 11660 | Utica | 38 | 55 | 6 | NA | 1.75 | 48 |
| 11670 | Utica | 43 | 51 | 6 | NA | 1.72 | 16 |
| 11680 | Utica | 38 | 57 | 5 | NA | 1.71 | 12 |
| 11690 | Utica | 40 | 57 | 2 | NA | 1.43 | 1 |
| 11700 | Utica | 39 | 57 | 4 | NA | 1.80 | 36 |
| 11710 | Utica | 39 | 58 | 3 | NA | 1.87 | 50 |
| 11720 | Utica | 44 | 53 | 4 | NA | 1.85 | 117 |
| 11730 | Utica | 33 | 63 | 5 | NA | 1.80 | 43 |
| 11750 | Utica | 32 | 63 | 5 | NA | 1.86 | 14 |
| 11760 | Utica | 40 | 59 | 2 | NA | 1.83 | 11 |
| 11770 | Utica | 35 | 62 | 3 | NA | 1.86 | 31 |
| 11790 | Utica | 35 | 63 | 2 | NA | 1.90 | 3 |
| 11800 | Utica | 35 | 63 | 2 | NA | 1.97 | 6 |
| 11810 | Utica | 30 | 60 | 9 | NA | 2.01 | 11 |
| 11830 | Utica | 34 | 64 | 3 | NA | 1.73 | 4 |
| 11840 | Utica | 35 | 63 | 2 | NA | 1.73 | 1 |
| 11890 | Utica | 33 | 46 | 21 | NA | 1.65 | 2 |
| 11900 | Utica | 30 | 49 | 21 | NA | 2.15 | 10 |
| 11910 | Utica | 26 | 55 | 19 | NA | 2.28 | 1 |
| 11920 | Utica | 31 | 48 | 22 | NA | 2.09 | 6 |
| 12010 | Point Pleasant | 25 | 45 | 31 | NA | 1.61 | 3 |
| 12020 | Point Pleasant | 36 | 18 | 46 | NA | 1.80 | 1 |
| 12030 | Point Pleasant | 28 | 30 | 42 | NA | 1.54 | 3 |
Table 7-12. Mineralogy, TOC and Reflectance Data for Marshlands No. 2.
NA – not analyzed
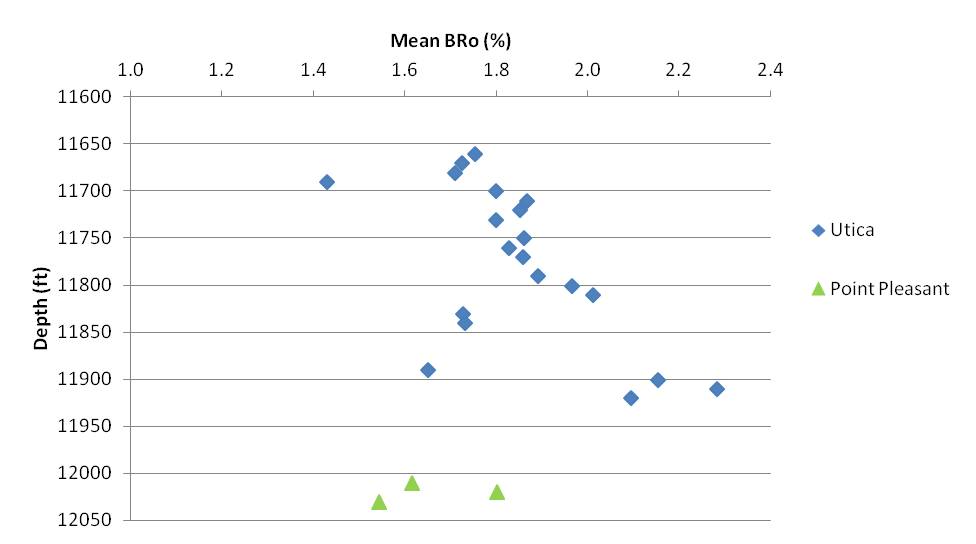
Figure 7-26. Crossplot of mean reflectance measurements (BRo%) versus depth in the Marshlands No. 2 well, Tioga County, Pennsylvania. A majority of measurements for both the Utica and Point Pleasant intervals fall in the 1.5 to 2.0% range.
A tabular summary of the mean bitumen reflectance values (by formation) is provided in Table 7-13. The mean BRo measured in this well is 1.82%.
| Formation | Mean BRo
(%) | Mean No. of
Observations (N) |
|---|
| Utica | 1.85 | 21.1 |
| Point Pleasant | 1.65 | 2.3 |
| Well Mean | 1.82 | 18.5 |
Table 7-13. Mean reflectance (BRo%) by formation, Marshlands No. 2.
Shade Mt. No.1 (API #3706720001)
Bitumen reflectance measurements were collected from the Shade Mt. No. 1 in Juniata County, Pennsylvania, over a 90-ft depth range comprised exclusively of the Point Pleasant Formation. Some intervals were excluded from analysis due to lack of bitumen macerals and/or insufficient maceral size.
In this well, the Point Pleasant Formation exhibits a steady increase in bitumen reflectance with depth (Table 7-14).
Depth
(ft) | Formation | Bulk Mineralogy | TOC (%) | Bitumen Reflectance |
|---|
Quartz+
(%) | Clay
(%) | Carbonate
(%) | Mean
BRo (%) | No. of
Observations (N) |
|---|
| 3690 | Point Pleasant | 33.2 | 9.9 | 55.9 | NA | 0.86 | 22 |
| 3700 | Point Pleasant | 35.6 | 9.7 | 54.8 | NA | 0.81 | 16 |
| 3710 | Point Pleasant | 35.6 | 6.9 | 57.2 | NA | 0.78 | 3 |
| 3720 | Point Pleasant | 39.4 | 6 | 54.6 | NA | 0.96 | 22 |
| 3730 | Point Pleasant | 40.8 | 5.9 | 52.8 | NA | 0.99 | 20 |
| 3740 | Point Pleasant | 51.6 | 6.7 | 41.6 | NA | 0.89 | 31 |
| 3750 | Point Pleasant | 48.4 | 14.4 | 37.6 | NA | 0.85 | 12 |
| 3760 | Point Pleasant | 48.3 | 14.1 | 37.7 | NA | 0.89 | 10 |
| 3770 | Point Pleasant | 51.3 | 19 | 29.8 | NA | 1.05 | 31 |
| 3780 | Point Pleasant | 64.2 | 20.3 | 15.5 | NA | 1.08 | 18 |
Table 7-14. Mineralogy, TOC and Reflectance Data for Shade Mt. No. 1.
NA – not analyzed
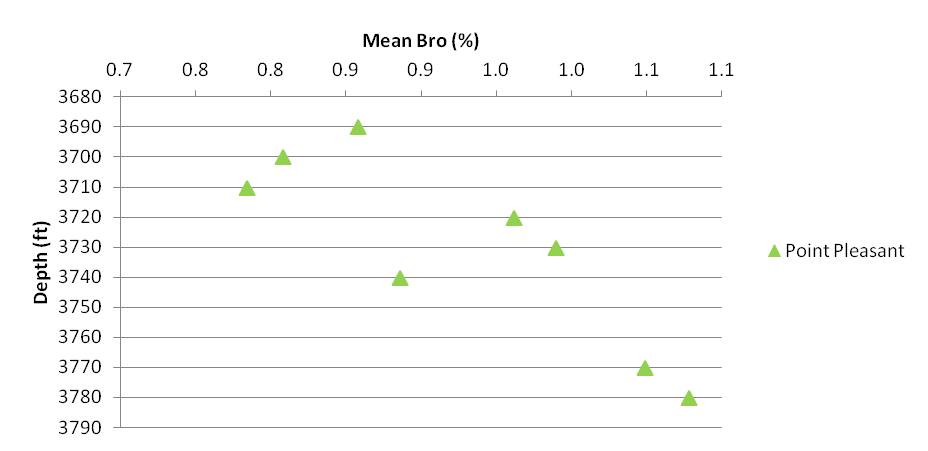
Figure 7-27. Crossplot of mean reflectance measurements (BRo%) versus depth in the Shade Mt. No. 1, Juniata County, Pennsylvania. Reflectance generally increases with depth.
A tabular summary of the mean bitumen reflectance values (by formation) is provided in Table 7-15. The mean BRo measured in this well is 0.92%.
| Formation | Mean BRo
(%) | Mean No. of
Observations (N) |
|---|
| Point Pleasant | 0.92 | 18.5 |
| Well Mean | 0.92 | 18.5 |
Table 7-15. Mean reflectance (BRo%) by formation, Shade Mt. No. 1.
Svetz No. 1 (API #3711120045)
Bitumen reflectance measurements were collected from the Svetz No. 1 in Somerset County, Pennsylvania, over a depth range of 140 ft comprised exclusively of the Utica Shale.
Many of the depth intervals sampled in this well lack reflectance measurements due to an insufficient number of observations (i.e., the number and size of bitumen macerals were limited) (Table 7-16).
Reflectance values range from 1.95 to 3.2% BRo, and no particular trends are noted with depth.
Depth
(ft) | Formation | Bulk Mineralogy | TOC (%) | Bitumen Reflectance |
|---|
Quartz+
(%) | Clay
(%) | Carbonate
(%) | Mean
BRo (%) | No. of
Observations (N) |
|---|
| 15,000 | Utica | 36 | 56 | 9 | 1.291 | 1.95 | 1 |
| 15,020 | Utica | 32 | 58 | 10 | 1.291 | 3.19 | 1 |
| 15,070 | Utica | 39 | 44 | 17 | NA | 2.64 | 3 |
| 15,090 | Utica | 39 | 47 | 15 | NA | 3.05 | 3 |
| 15,130 | Utica | 30 | 55 | 15 | NA | 3.27 | 4 |
| 15,140 | Utica | 31 | 55 | 14 | NA | 2.46 | 1 |
Table 7-16. Mineralogy, TOC and Reflectance Data for Svetz No. 1.
1 – Legacy TOC data reported by Laughrey and others (2009) for sample collected at 14,980-15,040 ft.
NA – not analyzed
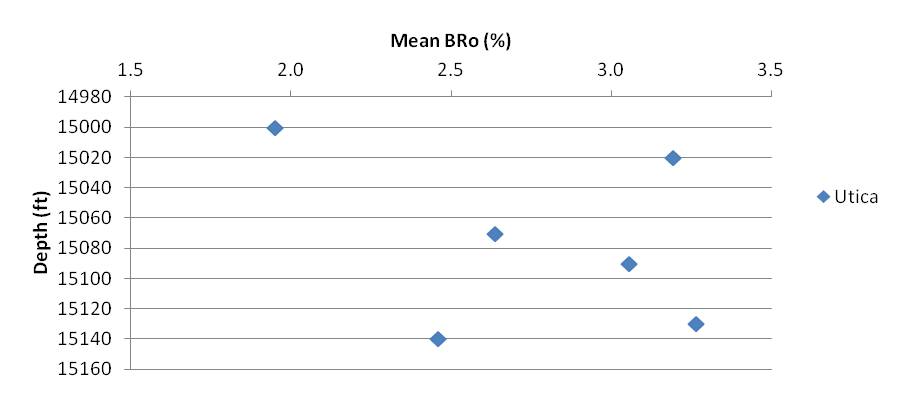
Figure 7-28. Crossplot of mean reflectance measurements (BRo%) versus depth in the Svetz No. 1 well, Somerset County, Pennsylvania.
A tabular summary of the mean bitumen reflectance values (by formation) is provided in Table 7-17. The mean BRo measured in this well is 2.76%.
| Formation | Mean BRo
(%) | Mean No. of
Observations (N) |
|---|
| Utica | 2.76 | 2.2 |
| Well Mean | 2.76 | 2.2 |
Table 7-17. Mean reflectance (BRo%) by formation, Svetz No. 1.
7.3.5.3 Bitumen Reflectance to Vitrinite Reflectance Equivalent Values
A correlation for transforming bitumen reflectance (BRo) measurements to vitrinite reflectance equivalent (Ro eq) values has yet to be published for the Utica Shale play.
In an attempt to address this situation, we have chosen a suite of correlations developed for other organic-rich shales to transform the Pennsylvania BRo data into Ro eq values. We have selected equations by Jacob (1989), Landis and Castaño (1994) and Schoenherr (2007) for this effort. Table 7-19 summarizes the mean bitumen reflectance values (BRo%) for each well, along with representative vitrinite reflectance equivalent values (Ro eq%).
An expanded discussion on this topic is provided in Appendix 7-D  (PDF, 305 KB; 7 pages).
| API No. | Well Name | Mean
BRo (%) | Calculated Ro eq (%) |
|---|
Jacob
(1989) | Landis and
Castaño (1994) | Schoenherr
(2007) |
|---|
| 3704920049 | PA Dept. of Forests & Waters Block 2 No. 1 | 1.4 | 1.3 | 1.6 | 1.6 |
| 3706720001 | Shade Mt. No. 1 | 0.9 | 1.0 | 1.2 | 1.1 |
| 3711120045 | Svetz No. 1 | 2.8 | 2.1 | 2.9 | 2.9 |
| 3711720181 | Marshlands No. 2 | 1.8 | 1.5 | 2.1 | 2.0 |
| 3712320150 | Shaw No. 1 | 1.7 | 1.5 | 1.9 | 1.9 |
| 3712522278 | Starvaggi No. 1 | 1.0 | 1.0 | 1.3 | 1.2 |
Table 7-18. Conversion of bitumen reflectance (BRo) measurements to vitrinite reflectance equivalent (Ro eq) values utilizing three different methods.
Using the correlations of Jacob (1989), Landis and Castaño (1994) and Schoenherr (2007), Ro eq values for the six Pennsylvania wells evaluated for this task range from 1.0 to 2.9% (Table 7-19). The Shade Mt. No. 1 has Ro eq values ranging from 1.0 to 1.2%, which would place it in the oil to early gas window. The PA Dept. of Forests & Waters Block 2 No. 1 (Ro eq – 1.3 to 1.6%), the Shaw No. 1 (Ro eq – 1.5 to 1.9%) and the Marshlands No. 2 (Ro eq – 1.5 to 2.1%) have values that would place these wells in the dry gas window. The Svetz No. 1 has Ro eq values ranging from 2.1 to 2.9%, which would place it in the dry gas to overmature window.
Using these correlations on the Starvaggi No. 1 well yields Ro eq values ranging from 1.0 to 1.3% (Table 7-18), which would place it in the peak oil to gas window. However, this particular well (the most recently completed well in this dataset) is known to have produced only dry gas, which is more consistent with reflectance results reported for this location by Cortland Eble (i.e., mean BRo of 1.79% and calculated Ro eq of 1.51%; see Section 7.3.3.3). To address this discrepancy, we have reviewed all bitumen reflectance data collected as part of this current work against those reported by Eble for his Pennsylvania dataset (Section 7.3.3.3), as well as those collected by Cooney (2013). Based on this review, we see consistent well-by-well results (where duplicate analyses were performed) and general agreement in thermal maturity trends across the state for all reflectance data but those of the Starvaggi No. 1. A review of our laboratory log books suggest that the discrepancy observed in BRo (and therefore, Ro eq) values for this particular location may be due to an unsatisfactory calibration of the petrographic microscope at the time the Starvaggi No. 1 samples were analyzed.
7.3.5.4 Discussion
Geographic Trends
Excluding the Shade Mt. No. 1 and adjusting the Starvaggi No. 1 to fall within the dry gas window, the calculated Ro eq values and associated Utica thermal maturities increase from west to east in Pennsylvania (Figure 7-29). Although many more data points would be required to delineate specific areas of thermal maturity, this pattern generally fits with previously published thermal maturity maps for the state (e.g., Repetski and others, 2008).
This means that moving eastward toward the structural front in central Pennsylvania, one could expect to find more thermally mature rocks, capable of producing natural gas, whereas relatively immature rocks in the northwest may produce oil and/or condensate.
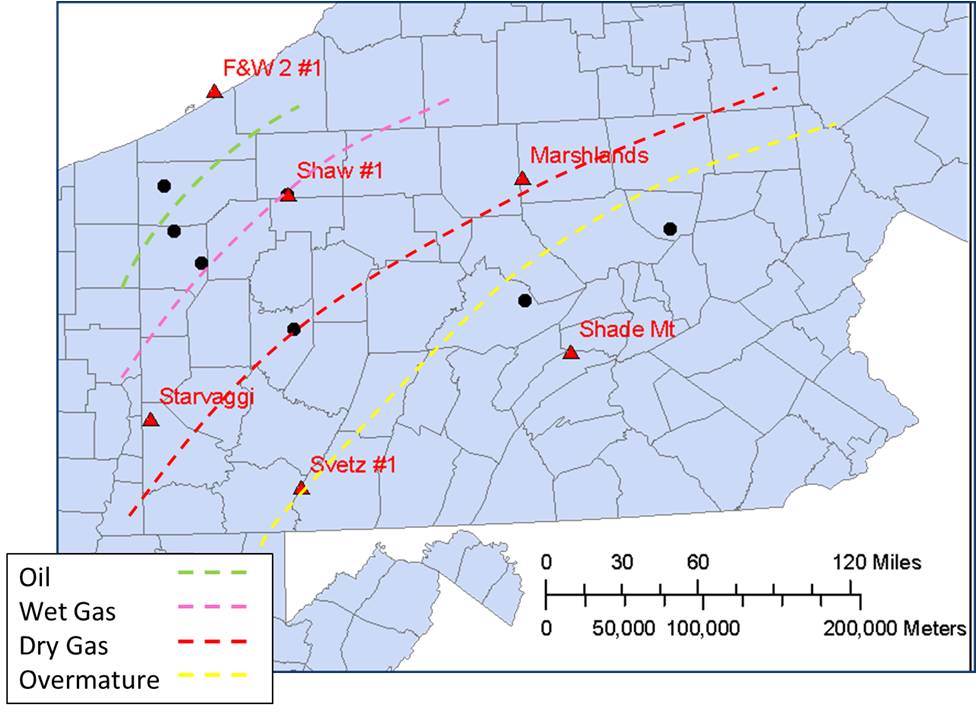
Figure 7-29. Map of Pennsylvania showing approximate thermal maturity boundaries for the Utica Shale play, based on Ro eq values calculated as part of this Study.
Thermal Maturity with Depth
Overall, we observed a general trend of increasing reflectance with depth of formation. While the relationship between depth and BRo% was not exactly linear,
in most cases mean BRo% for each formation increased from the Kope to Utica, Utica to Point Pleasant and Point Pleasant to Lexington/Trenton.
For some locations (i.e., Shaw No. 1 and Starvaggi No. 1), we observed a “funnel” pattern in the BRo% data when plotted against depth – in other words,
a wide range in BRo% values was recorded in shallower formations, and more similar BRo% values were measured in deeper formations.
The large range of values in shallow formations seems to artificially raise the mean BRo% values in some wells, causing shallower formations to appear more mature than deeper formations.
Correlation of Bitumen Reflectance with Other Data
We observe no strong correlation between bitumen reflectance and mineralogy, GR log signatures and/or TOC analyses. In some wells, variations in reflectance coincide with changes in one or more of these parameters, but in others there does not appear to be any relationship among the data. In the PA Dept. of Forest & Waters Block 2 No. 1 (Erie County, Pennsylvania), the highest reflectance values occur near the Utica-Lexington/Trenton contact and do not coincide with any mineralogical changes. By contrast, in the Shade Mt. No. 1 (Juniata County, Pennsylvania), the highest reflectance values occur in the Point Pleasant, near its contact with the Lexington/Trenton Formation, and coincide with increasing quartz and clay, and decreasing carbonate. In the Marshland Unit No. 2 (Tioga County, Pennsylvania), the opposite phenomenon occurs; here, increasing BRo% coincides with a notable increase in carbonates and a decrease in quartz and clay. In two locations (the Shaw No. 1 of Warren County and Starvaggi No. 1 of Washington County), we observed intervals of higher and lower reflectance scattered throughout the entirety of the sampled intervals. In both wells, the number of measureable macerals (N) increases near the Utica-Point Pleasant contact and even more dramatically at the Point Pleasant-Lexington/Trenton contact. In the Starvaggi No. 1, where TOC data were collected, this increase in N coincides with an increase in TOC.
Sources of Error
Various sources of error can impact bitumen reflectance analyses. Bitumen can be altered by weathering to produce a mixture of less optically unaltered migrabitumen (i.e., solid oil bitumen), minerals and coke from bitumen (Jacob, 1989), making reflectance analysis increasingly difficult. Additionally, as maturity increases, more or less intense optical anisotropy and mosaic texture may develop (Jacob, 1989). For this reason, some studies (Jacob, 1989; Landis and Castaño, 1994) use only the lowest reflectance distribution when assessing the relationship between vitrinite and bitumen reflectance values. Landis and Castaño (1994) distinguish among the three optical forms of hydrocarbon, illustrating how histograms can be convoluted if the distinction is not made among the types. Further, Landis and Castaño (1994) derive “errors” in previous reports of correlation (Jacob, 1989; Riediger, 1993) between BRo and Ro studies due to a lack of indigenous virtinite, mixing of locally derived and migrated solid hydrocarbon, mixing of morphological types, limited maturation range and use of suppressed vitrinite data.
Thermal maturity analysis by way of reflectance microscopy requires a sufficient number of measurements on organic macerals to provide reliable data (~50) (Schoenherr, 2007). In most cases, however, the Utica/Point Pleasant rock cuttings available for this task provided less than 30 macerals of sufficient size per sample.